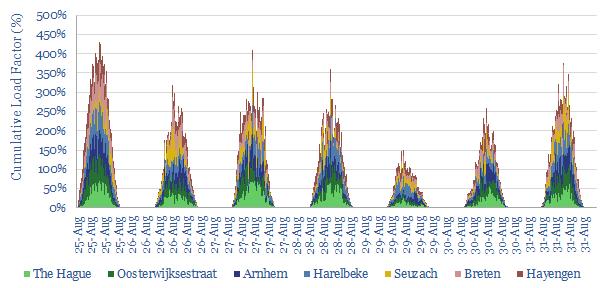
This data-file aggregates granular data from seven solar assets around Western Europe (Netherlands, Germany, Belgium, Switzerland), to understand their volatility and inter-correlation, over a sample week in August-2021.
Across the entire week, the average solar plant generated at 12% of its nominal capacity, the 90th percentile was 40% and the maximum was 75%; which may suggest that the panels have been oversized relative to inverters or MPPT is not fully optimized.
Volatility and inter-correlations are quantified in the data-file, but are generally high. For example, over >500km distances, different solar generators’ 15-min by 15-min output is 60-80% correlated, which is even greater than for offshore wind (data here).
These issues suggest solar can provide a meaningful portion of decarbonizing grids, but surpassing 20% requires back-ups.