Hydro power generation by facility is tabulated in this data-file for the 20 largest hydro-electric plants in the US. The average US hydro facility achieves 43% availability, varying from 39% in hot-dry years to 51% in wet years; and from 33% at the seasonal trough in September-October to 53% at the seasonal peak in May-June. What implications for energy markets and backstopping renewables?
The US generates 260 TWH of hydro power per year, 6% of its total electricity, of which 130 TWH comes from its top twenty largest hydro facilities, with over 30 GW of combined capacity. For further details, please see our US energy and CO2 model.
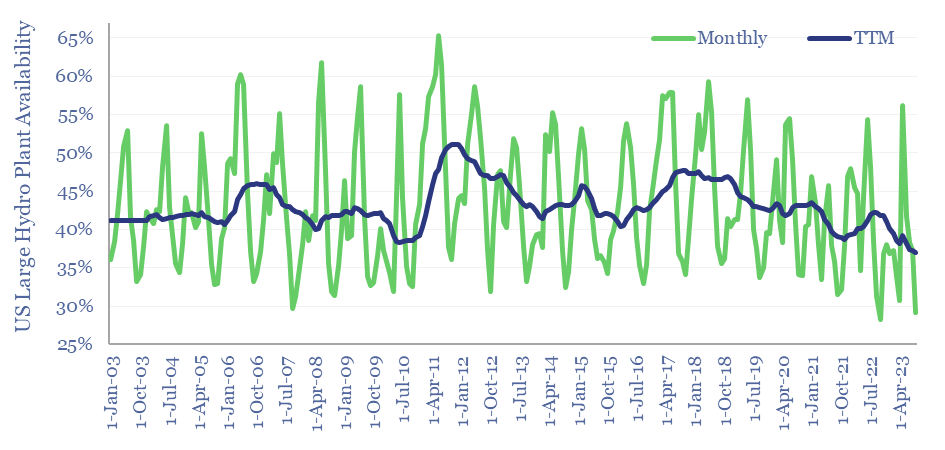
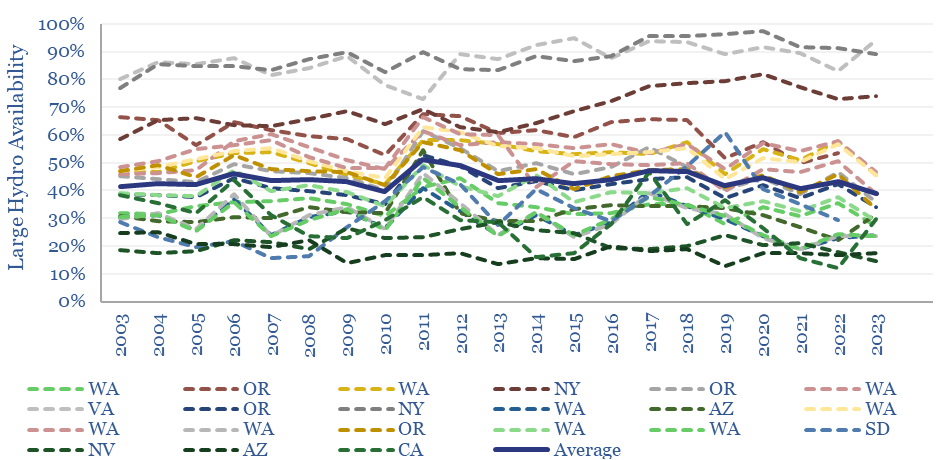
Month-by-month hydro power generation is tabulated in this data-file, for the top twenty largest US hydro-power plants. For example, the single largest hydro facility in the US is the Grand Coulee Dam, on Washington State’s Columbia River, built in 1967, and now with 6.8 GW of nameplate capacity. However, different plants vary (chart below), so it is useful to average out the data (chart above).
How well suited is hydro for backstopping renewables? In the short term, from minutes to days, hydro is an excellent backstop for solar and wind (note below), with fast start-up times, fast ramp-rates and flexibility suggested by an average availability factor of 44% for large hydro facilities over the past 20-years. In other words, there is scope to dial hydro plants up or down.
For longer-duration renewables volatility, hydro may be a less effective backstop, however. Especially for solar. The availability factors of hydro follow a clear annual pattern, ranging from 30-65%, peaking at 53% on average in May-June fed by meltwater from spring, troughing at 33-34% in September-October after hot and drought-prone summers. Seasonality is plotted in the data-file.
To ensure resiliency in renewables-heavy grids, it should be noted that some years are rainier than others. Hence the annual availability across all large US power plants ranges from 39% to 51%.
The trend also appears to show hydro availability gently falling in recent years, possibly linked to hotter weather. Different studies vary but have estimated that climate change could lower hydro generation by around 10% by mid-century on average. Details in the data-file.
Hydro variability can impact global energy balances. Global electricity demand was 30,000 TWH in 2023. We find that a particularly wet or dry year, across the board, can sway global electricity market balances by as much as a full percentage point.
Please download the data-file for the underlying numbers into hydro power generation by facility, at the twenty largest US hydro plants, month-by-month, going back 20-years to 2003.