
This data-file is our China Energy Model and China CO2 Model, disaggregating China’s energy demand by industry, across coal, oil, gas, wind, solar, hydro and nuclear, across c200 lines, from 2000-2060, with 20-input variables that can be stress-tested. By 2050, useful energy demand rises by 38%, electricity demand doubles, and CO2 falls back by 40%.
The goal of our China energy model is to track China’s historical energy demand and CO2 emissions, and stress-test different scenarios for China’s future energy demand and CO2 emissions, to be consistent with our broader global energy models.
China matters as it contains 17.5% of the world’s population at 1.4bn people, 17% of the world’s GDP at $19 trn, 30% of the world’s manufacturing GDP at $5trn, 25% of the world’s useful energy consumption at 22,400 TWH pa, and 30% of the world’s energy-related CO2 emissions at 12 GTpa.
Demographic changes. The latest forecasts from the World Bank are that after rising at a 20-year CAGR of 0.5% pa, China’s total population actually peaked around 2020 at 1.43bn people and will gently decline back to 1.2bn by 2050. GDP growth slows from 8% pa in the past 20-years to 3% pa through 2050, which places China’s 2050 GDP per capita on the same level as Japan today, but 50% below the US.
Useful non-industrial energy per capita is only able to rise by about 50% from 6MWH pp pa today to 10MWH pp pa by 2050, versus 20 MWH pp pa in the developed world today. And no rebound effects are included. This sees China’s total energy demand rising by one-third, to over 30,000 TWH per year.
2025’s useful energy mix in China was 58% coal, 13% gas, 11% oil, 6% hydro, 5% wind, 4% solar, 2% nuclear. CO2 thus exceeds 12GTpa. Our models are primarily driven by economics. CO2 remains at 8GTpa by 2050.
Coal still provides 60% of China’s total useful energy today, or 25,000 TWH of primary energy, equivalent to 45Mbpd of oil, or 4x Saudi Arabias of oil. But coal demand flatlined in 2025, at 4.9GTpa, and may be maturing.
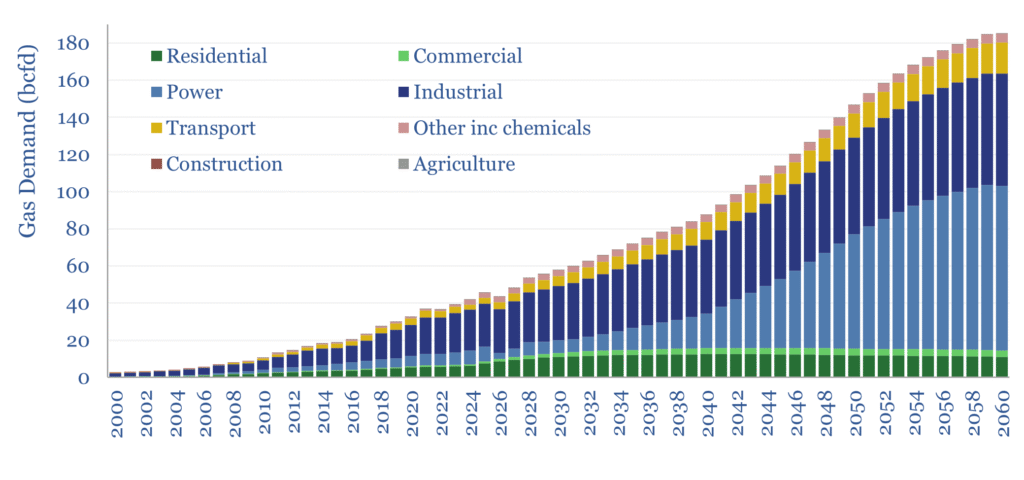
As coal matures, and despite also ramping renewables, China becomes the biggest natural gas market in the world, rising from 45bcfd in 2025 to 60bcfd by 2030, to 75bcfd by 2035, 90bcfd by 2040 and 140bcfd by 2050. China’s LNG imports could thus quintuple from c80MTpa to c400MTpa by 2050.
China’s electricity generation grew by 3.5% in 2025, to reach 10,425 TWH, which on a per capita basis, is now actually higher than Europe’s at 7.4 MWH pp pa vs 7 MWH pp pa (but half the US’s at 13MWH pp pa).
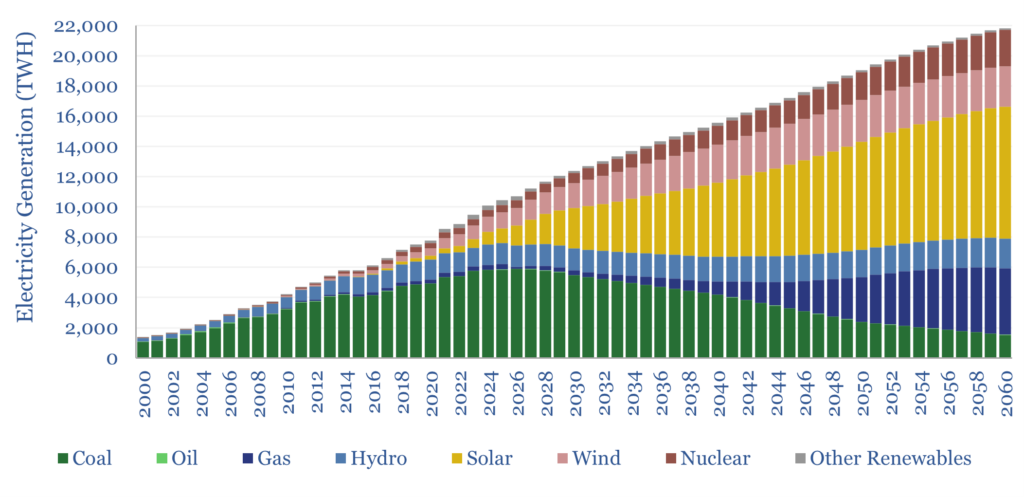
For 2025, we estimate that 3.5% growth in electricity generation was c50% met by solar growing +20% YoY, 17% met by wind growing 6% YoY, 12% by nuclear growing 9% YoY, and 5% met by gas-fired power growing 6% YoY.
Oil demand in China was 16.6Mbpd in 2025, having grown by +300kbpd/year since 2019, but likely plateaus at 17Mbpd in 2027-30. Chinese drivers bought 14M EVs in 2025, two-thirds of the global total, although this may decline YoY in 2026 as incentives scale back.
Through 2050, we see total useful energy demand in China rising by 40%, which is met by ramping solar 7x, wind 2.75x, nuclear by 3.7x, gas by 3.4x, hydro by +40%, while oil falls -17% and coal matures and falls -60%.
A full breakdown, across 235 lines, from 1990-2060, is in our model, largely informed by data from China’s National Bureau of Statistics.
The purpose of this model is to allow decision-makers to stress test input assumptions, and their impacts on China’s energy use and China’s CO2 emissions. Key input variables include population growth, GDP growth, residential energy use, various metrics for efficiency gains and the final share of different generation sources in the power mix.