Some commentators criticize that methane leaks detract from natural gas as a low-carbon fuel in the energy transition. Compared with CO2, CH4 is a 25-125x more potent greenhouse gas (depending on the timeframe of measurement). Hence, leaking 2.7-3.5% of natural gas could make gas “dirtier than coal”. However, for an apples-to-apples comparison, we must also consider the methane leaks from coal and oil. Natural gas value chains have the lowest methane leakage rates of the three.
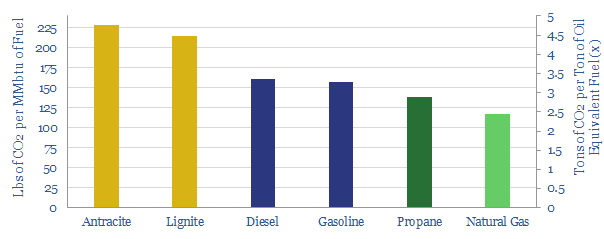
When combusted, natural gas emits >50% less CO2 than coal, at c320kg/boe versus as much as 850kg/boe. Generating 1MWH of power from natural gas emits 0.35T of CO2, versus 0.85T for coal (chart below, data here).
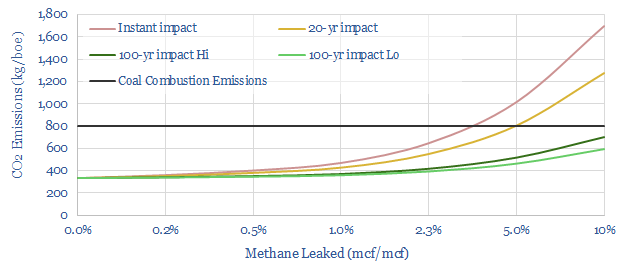
But it has been criticized by some commentators that natural gas value chains leak methane. Methane is a 120x more potent greenhouse gas than CO2. It degrades over time, due to hydroxyl radicals in the atmosphere. So its 20-year impact is 34x higher than CO2 and its 100-year impact is 25x higher. Therefore, if c2.7-3.5% of natural gas is “leaked” into the atmosphere, natural could be considered a “dirtier” fuel than coal (chart below, model here).
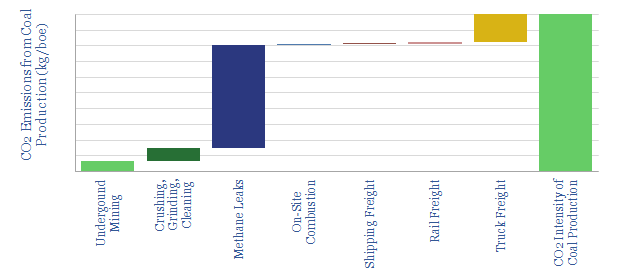
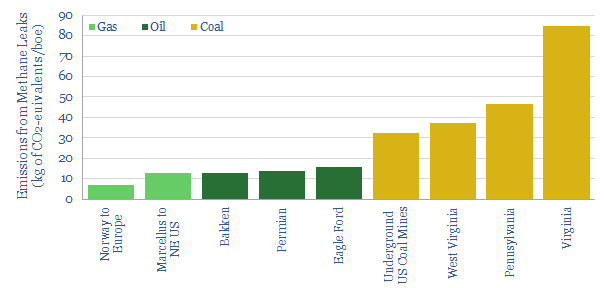
Is this comparison apples-to-apples? After tabulating EPA disclosures, we find that the US underground coal mining industry emitted 1.4MT of methane in 2018. This is because natural gas often desorbs from the surface of coal as it is mined, and can thus be released into the atmosphere. For comparison, 250M metric tons of coal were produced from underground mines in 2018, out of 700MT total coal production. In other words, for every ton of underground coal production, the methane leakage rate was 0.6%, equivalent to around 33kg/boe (chart below, data here).
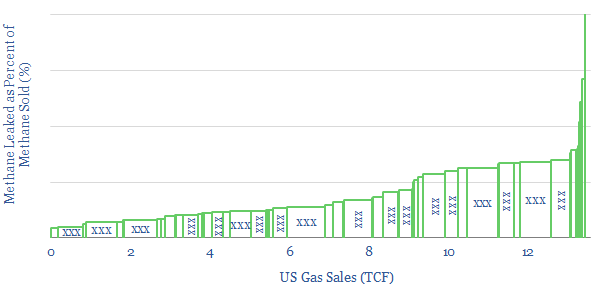
For comparison, similar EPA disclosures imply that the methane leakage rate in the upstream US oil and gas industry ranges from 0.1% through to 1.1%, with an average of 0.26% (chart below). The data are available here, by basin and by operator.
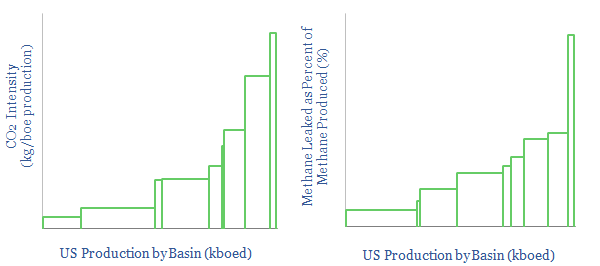
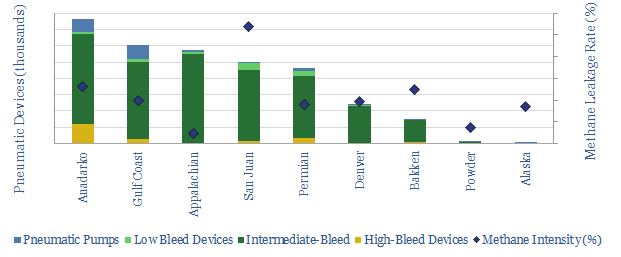
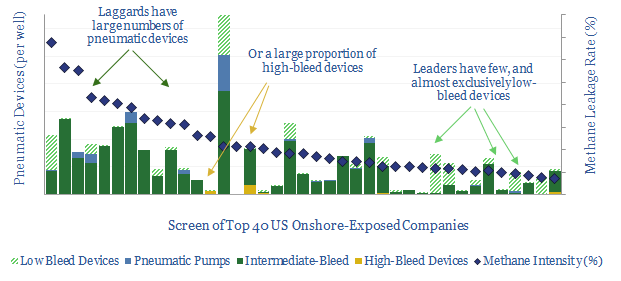
The US upstream methane leakage rate also appears to be much higher for associated gas in oil basins than non-associated gas in gas basins. The Marcellus is the lowest-leak basin in our sample at 0.1%, versus the Permian, Bakken and Eagle Ford at 0.4-0.5% (chart below, which also correlates the leakage rates with the number of pneumatic devices).
The fairest comparison must also add in the methane leaks from gas gathering, processing and distribution to end-customers (chart below), in order to capture the methane emissions expected across the entire gas value chain. This takes our estimate for total US methane leaks to 0.6% of commercialised gas. Leading the industry, we find the total end-to-end value chain taking Norwegian gas to European consumers leaks around 0.23% of the methane (note here).
Converting back into energy-equivalent units is the most comparable metric, to assess the methane leakage rates of different energy resources. The average ton of coal mined under the US contains 23mmbtu of energy (11,584btu/lb). The average ton of oil contains 40mmbtu and the average ton of gas contains almost 50mmbtu. In turn, this is because greater molar portions of oil and natural gas are from hydrogen molecules, which are very light, but generate energy when they are combusted into water vapor. Dividing through, we calculate the methane intensities below.
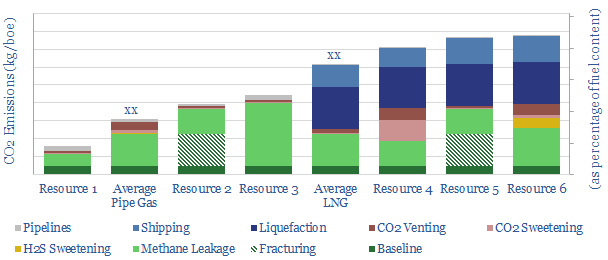
Looking most broadly, we find the total emissions profiles of commercializing piped natural gas will tend to run at 25kg/boe (chart below, model here), the total emissions profile of producing coal will tend to run at 50kg/boe (model here) and the total emissions profile of commercializing oil will tend to run at 60kg/boe (model here). This is deeply favorable for the credentials of natural gas as a low-carbon fossil fuel. It adds to the favorable credentials for combusting natural gas versus other fossil fuels.
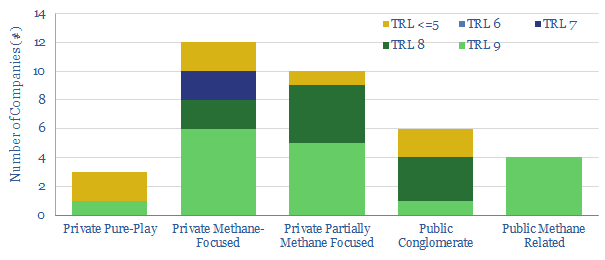
None of this is to exonerate leaks in the natural gas industry, which remains an urgent challenge for upstream producers to resolve. We are excited by the opportunity and have recently screened companies in the supply chain that can help mitigate methane (chart below, note here, screen here).
What producer impacts? We have also screened the leading and lagging operators around the industry, as ranked by their methane leaks, and after looking across 750,000 bleeding pneumatics that need to be phased out (chart below, data here).
Across all of our research, we find very strong credentials for natural gas as the fuel for the energy transition. All of our research into gas opportunities is linked here; and our work into LNG is linked here.