Air conditioning energy demand is quantified in this data-file. In the US, each 100 Cooling Degree Day (CDD) variation adds 26 TWH of electricity (0.6%) demand and 200bcf of gas (0.6%). Total global demand for air conditioning consumes 1,885TWH of electricity (7% of all global electricity, 2.5% of all global useful energy). IEA numbers see air conditioner demand trebling, from 1.9bn to 5.6bn by 2050, underpinning 3,500-6,000 TWH of electricity demand for air conditioning in 2050. We think the numbers could be materially higher, and will more than treble from 2021 levels.
A brief history of air-conditioning. In 3rd Century Rome, Emperor Elagabalus built a mountain of snow in his summer villa, permanently replenished by donkeys descending from the mountains. Similarly, Seneca mocked the “skinny youths” who ate snow rather than simply bearing the heat ‘like a proper Roman’. Millennia later, dying US President James Garfield was palliated by blowing air over ice-water: The White House went through half a million pounds of ice in two months. It took until 1902 for the first modern air conditioner to be invented, by Willis Carrier, while he was working at the Sackett-Wilhelms printing plant in Brooklyn. His systems sent air through coils filled with cold water, where the latent heat of evaporation would be transferred out of the water into the air. In 1922, Carrier added a centrifugal chiller, to reduce the unit’s size. Carrier Air Conditioning later developed a belt-driven condensing unit and mechanical controls for commercial units by 1933.
A surprising influence on the entirety of 20th century society stems from this world-changing invention of air conditioning. It was debuted at the Rivoli theatre, in Times Square, in 1925. Some sources say that the movie industry’s “summer blockbuster” even has its roots in air-conditioned cinemas, as American audiences would attend as much for the coolness as the entertainment. At the same time, US populations began expanding into otherwise inhospitable regions of the sun belt. The US population living in the sunbelt has risen from 28% in 1950 to over 40% today. In 1960, the tiny town of Las Vegas hosted 100,000 people, and it has since grown by a factor of 30x. Over a similar timeframe, Persian Gulf Cities went from 500,000 people in 1950 to 20M now, and now these hot climates even host air-conditioned football stadiums and indoor ski-slopes.
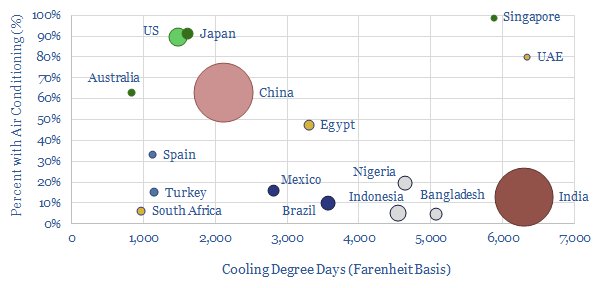
Present energy demand. By 2022, there are 1.9bn air conditioners in circulation globally, of which two thirds are situated in China (c60% household penetration), the US (90%) and Japan (91%). They accounted for 1,885TWH of electricity demand in 2020 (7% of world electricity consumption). They accounted for 390TWH of US electricity in 2021, comprising 10% of the US’s electricity consumption, of which two-thirds are residential, one-third commercial, as the average US household uses 2,000 kWh per year of electricity for air conditioning. This share rises to 25% of ASEAN’s, 30-40% of Singapore’s electricity consumption, and up to 70% of the UAE’s.
Future energy demand. The IEA projects that by 2050, the number of air conditioners around the world will reach 5.6bn (up 3x). This could see air conditioning demand rise to 3,500-6,000 TWH of electricity in 2050, depending on future efficiency initiatives. c75% of the gain is seen coming from increasing income in emerging markets, as less than 10% own air conditioners in India and Africa, compared with 44% of the world’s “hot climate population” today. Another c25% of the demand increase is actually expected to come from climate change itself.
We think IEA numbers are light, and the most likely output will see total global electricity demand for air conditioning rising by over 3x, to well above 6,000 TWH pa by 2050. In a ridiculous case, where 1.4 bn people in India ultimately aspired to achieve a US-level of air conditioning comfort, despite India’s 4x hotter climate (as measured by cooling degree days), then the resultant energy demand in this one country alone would be 6,500 TWH (10% of today’s total global energy), equivalent to 1,000 MTpa of LNG demand. These numbers are insanely high. They are quantified back-of-the-envelope in the data-file.
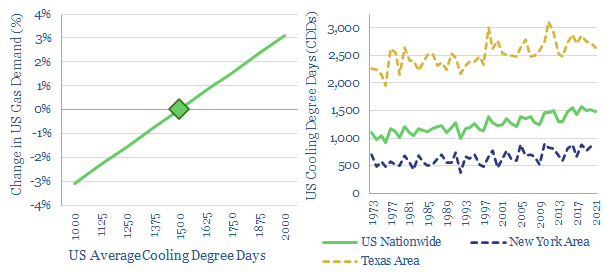
Weather dependency. Power demand can double on a hot day versus a mild day, in a city with heavy air conditioning demands. This happens to be at the exact same time that heat detracts from the output capacity of solar, wind, gas plants, nuclear plants, power lines. Hence we have previously noted how “hell is a hot still summer’s day” if you are power-grid planner. This data-file calculates how energy demand changes with cooling degree days. Against a baseline of 1,500 US Cooling Degree Days per year (in Fahrenheit terms), a good rule of thumb is that each 100 Fahrenheit variation will add 26 TWh of electricity demand, which equates to 200bcf of gas demand, or 0.6% upside in total US gas consumption. Numbers can be stress-tested in the data-file.
Incremental technologies are envisaged to make future air conditioning more efficient, and even take the string out of growing global cooling demands. Interesting options that have crossed our screens include improving insulation, smart energy, phase change materials, heat pumps, power factor correction, absorption chillers with CHPs, and urban trees that can reduce temperatures in cities by 2-8°C.