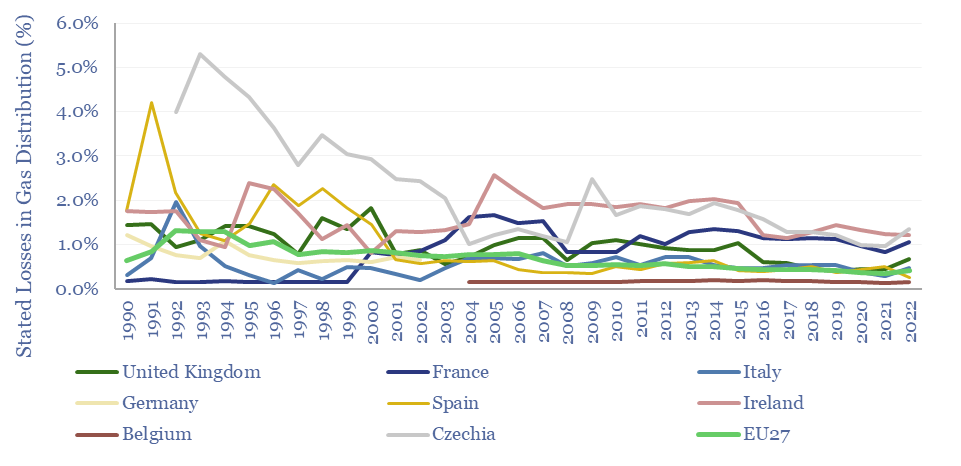
What are the loss rates in gas distribution? 1-4% of all the gas that flows into downstream gas distribution networks may fail to be metered and monetized. Stated leakage rates are usually around 0.5%, but could be higher. This data-file aggregates data from Eurostat and the UK’s Joint Office of Gas Transporters.
1-4% of all of the natural gas that flows into downstream gas distribution networks may fail to be metered and monetized. This matters not just for avoiding methane leaks, but also should ideally be improved before integrating biogas or blending hydrogen, or for ensuring that similar issues do not lessen trust in CCS value chains.
In the US, the variation between gas inputs to the gas distribution network and gas that is ultimately metered by customers is designated as Lost or Unaccounted For (LAUF). LAUF gas is generally estimated at 1-4%, and one study quotes an average rate of about 2% across the nation. In the past, the American Gas Association has somewhat questionably stated LAUF is mainly a metering and accounting adjustment and [sic] “there is no correlation between LAUF and emissions”.
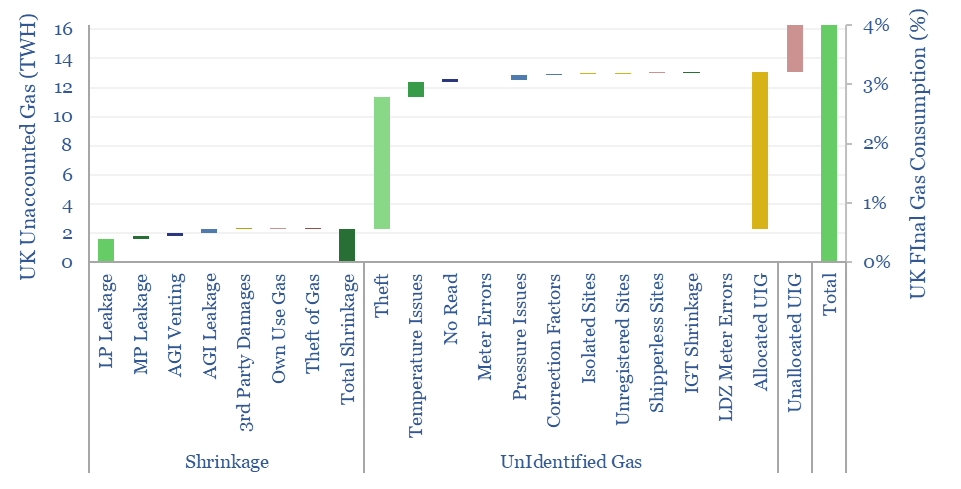
In the UK, the variation between gas inputs to the gas distribution network and gas that is ultimately metered by customers is split between Shrinkage (losses, mostly leaks) and other Unidentified Gas (UIG, e.g., due to theft, or pressure-temperature differences at metering sites). In gas year 2023/24, 0.6% of the gas flowed into the downstream distribution network was lost as shrinkage and 3.5% as Unidentified Gas, based on data from the UK’s Joint Office of Gas Transporters (see below).

Stated loss rates in developed world distribution networks are usually around 0.5%, based on data from Eurostat, but higher LAUF/UIG rates have opened the door to gas skeptics alleging higher leakage.
