-
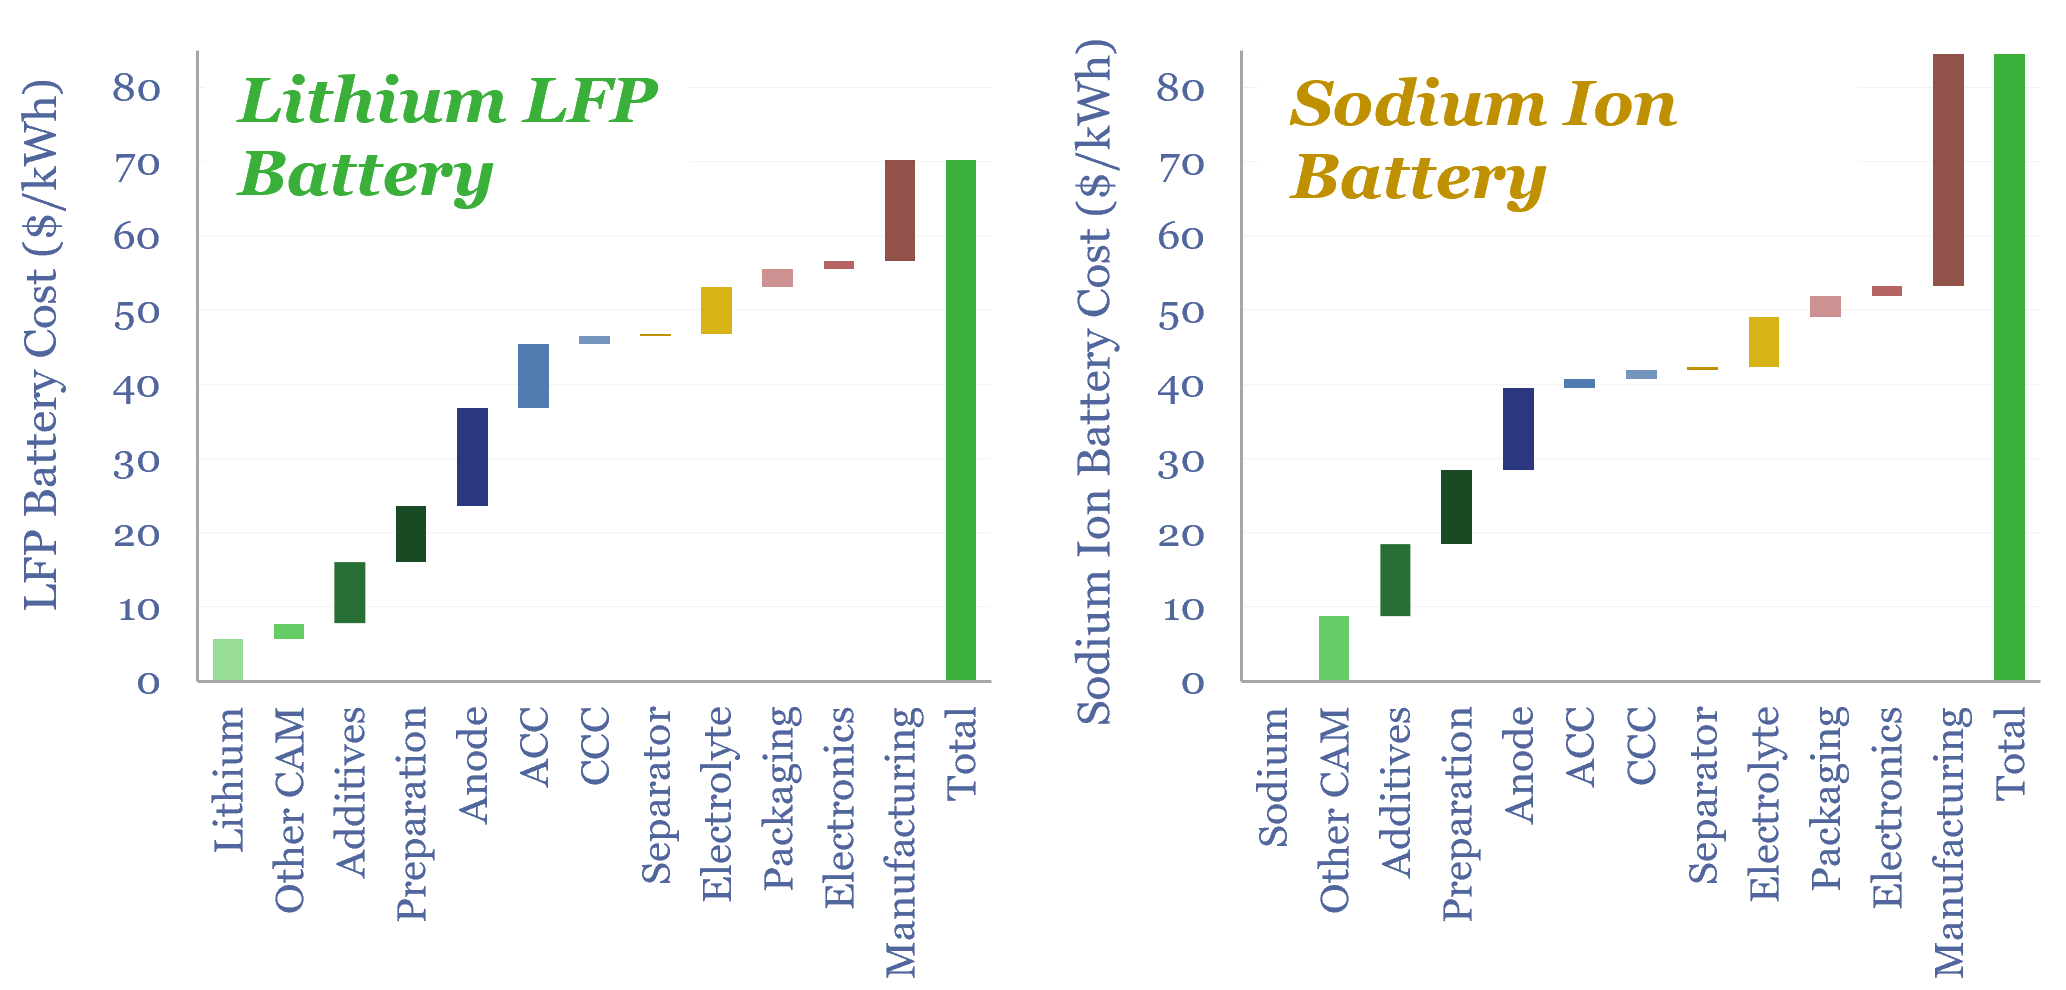
Sodium ion batteries: comparing costs versus LFP?

Sodium is 1,000x more abundant than lithium in the Earth’s crust and 99% cheaper. So will sodium ion batteries disrupt lithium ion batteries? Not until lithium carbonate prices treble to $40/kg. Or novel SIB electrode materials emerge. This 16-page SIB deep-dive de-risks our lithium market outlook.
-
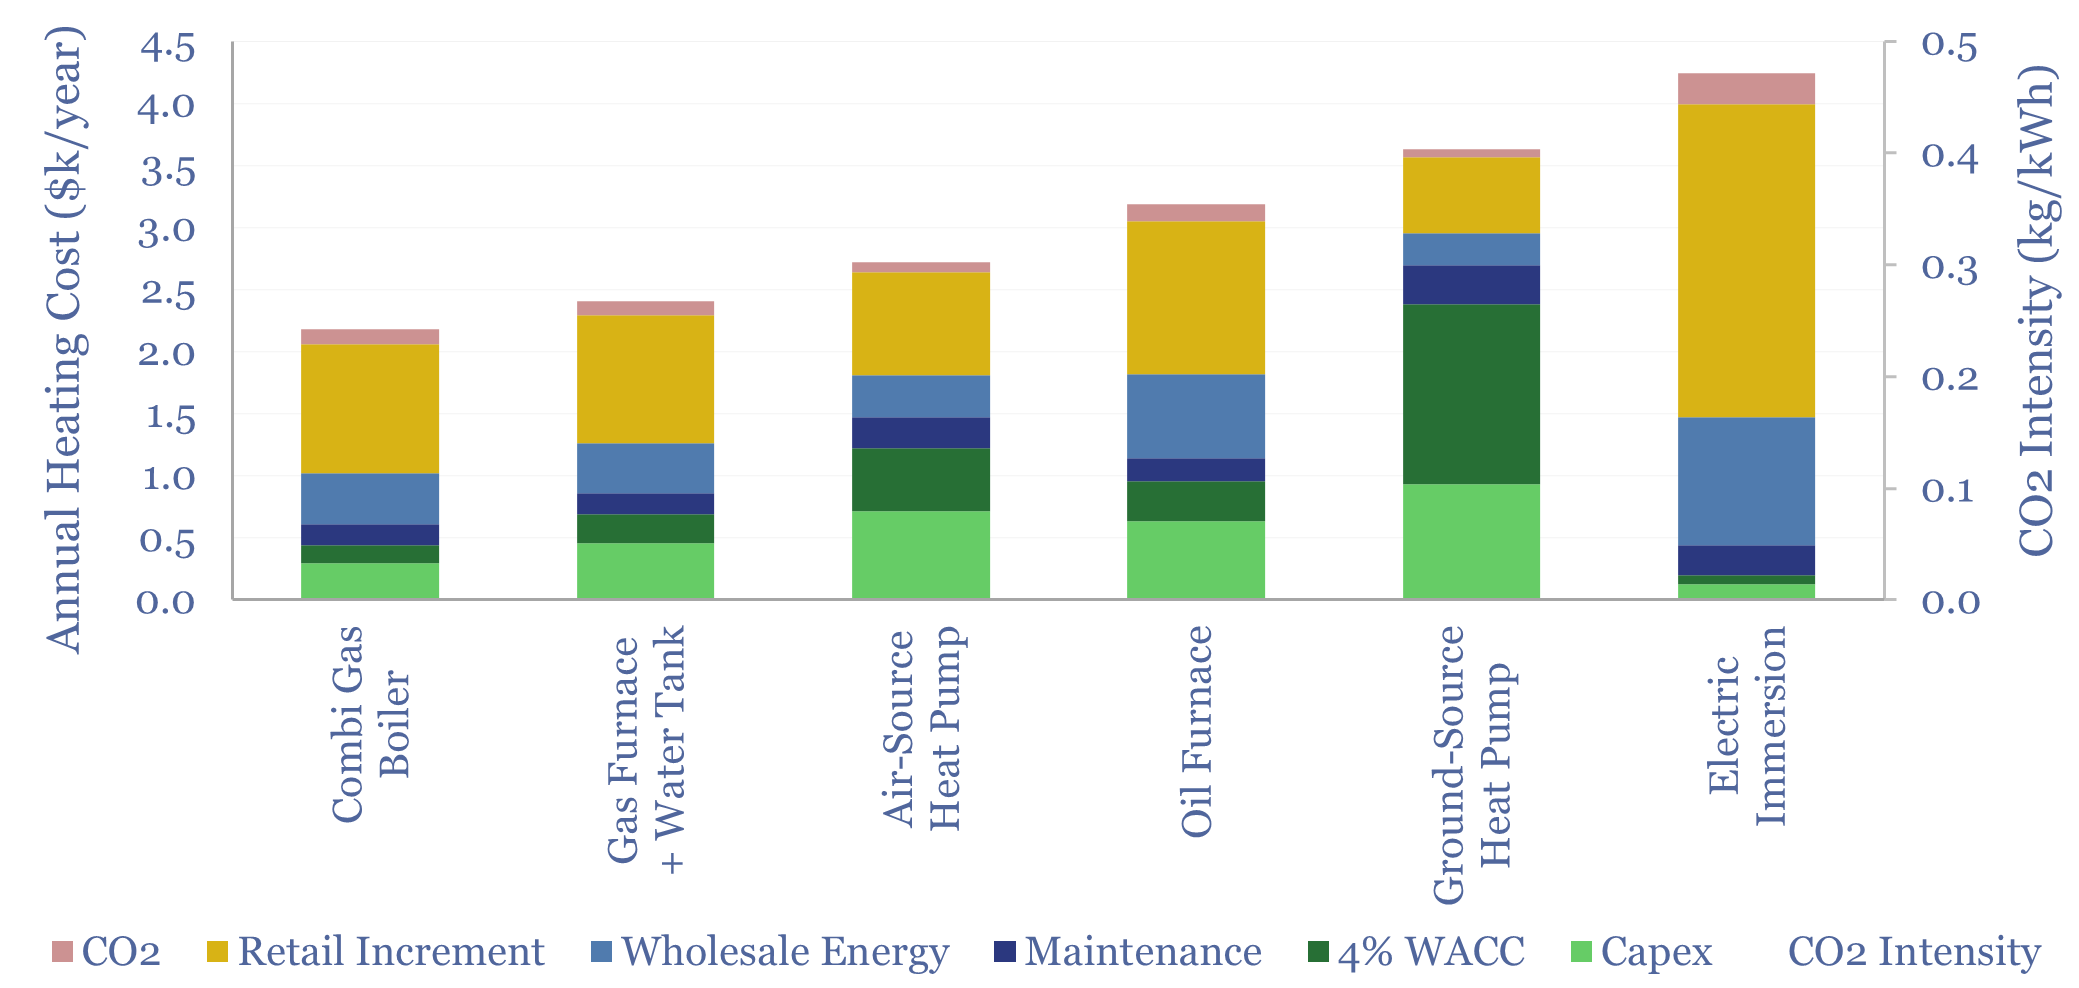
Residential heating costs: boilers, furnaces, electric and heat pumps?

Residential heating costs are compared and contrasted in this data-file, for gas-fired combi boilers, gas furnaces and hot water tanks, oil furnaces and hot water tanks, purely electric heating systems including immersion heaters, air-source heat pumps and ground-source heat pumps. Capex, maintenance and input energy prices can be stress-tested.
-
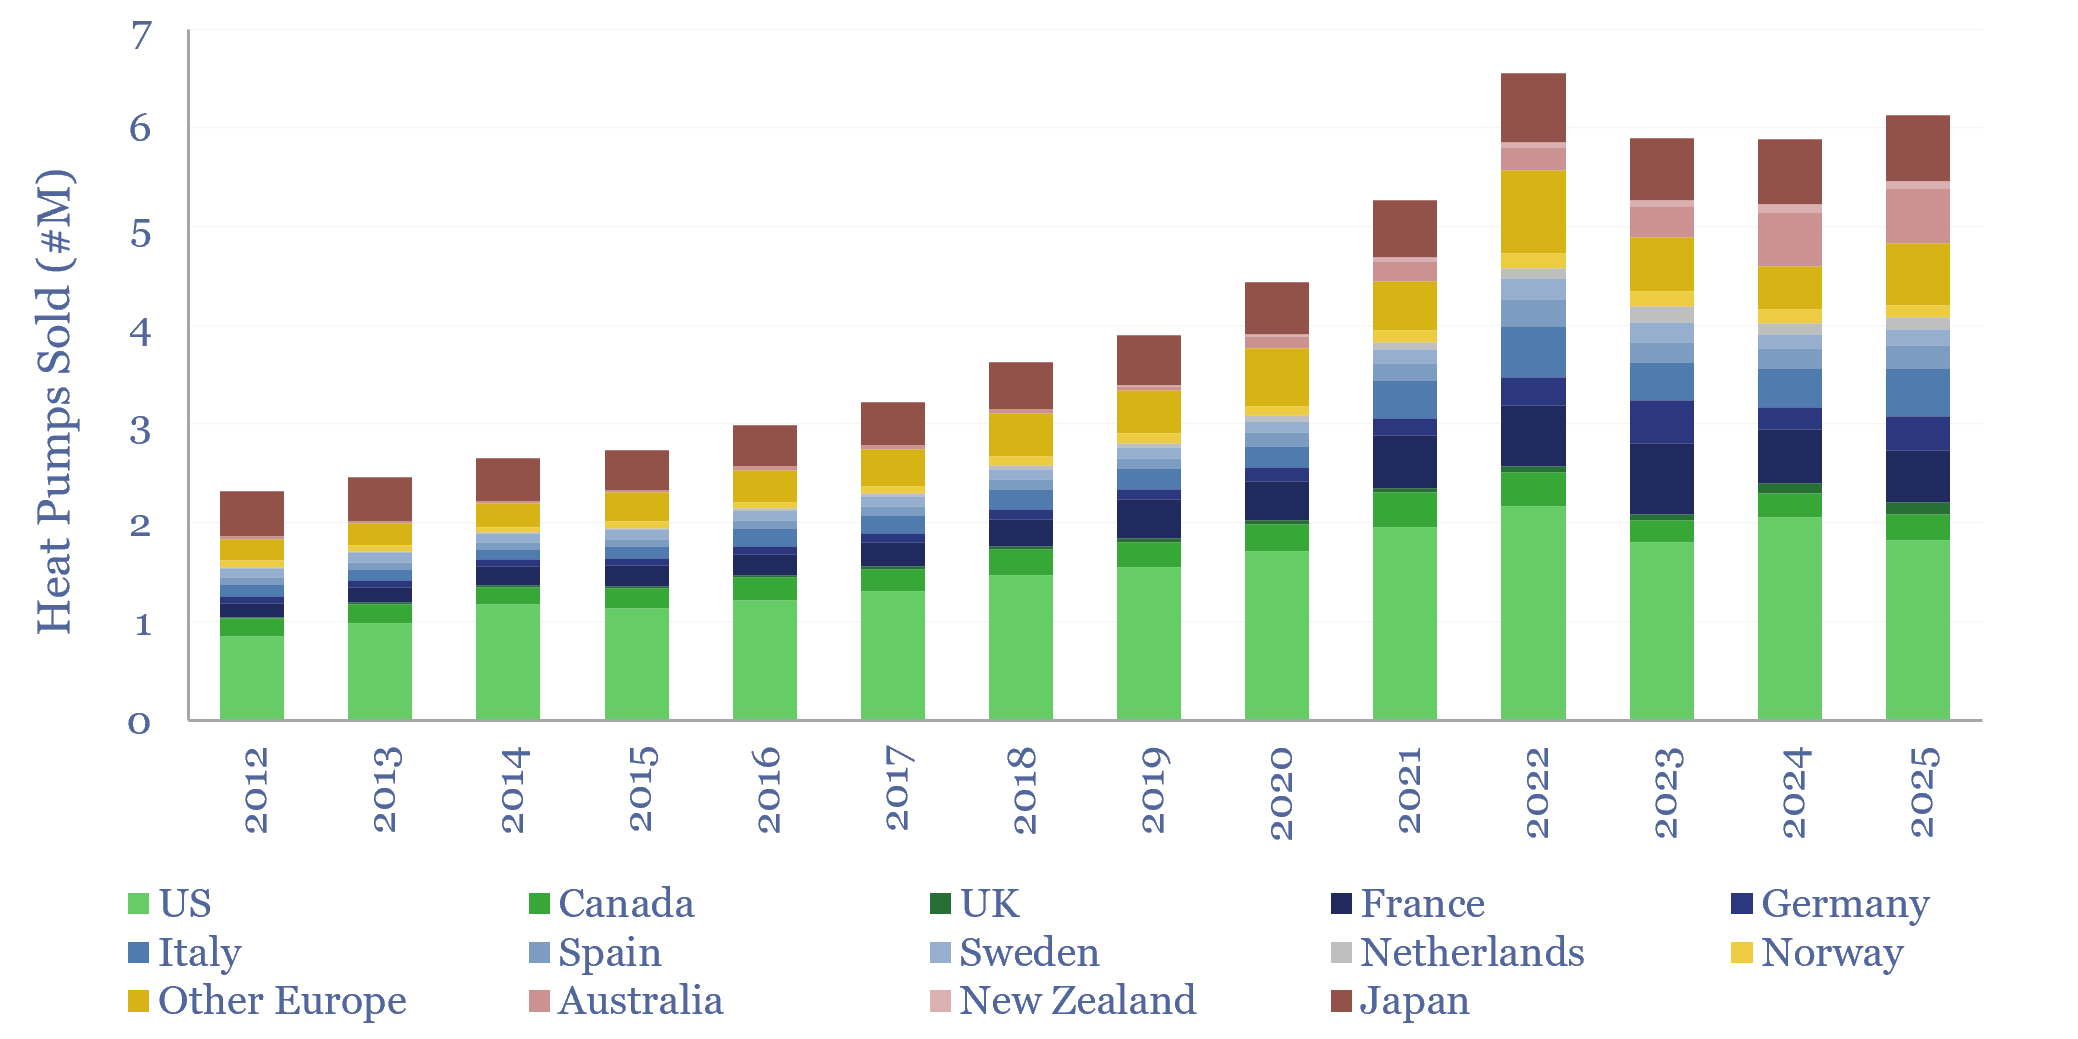
Global heat pump sales by country?

Global heat pump sales by country are tabulated in this data-file, for 14 countries/regions. Developed world heat pump sales rose at an 11% CAGR over the decade since 2012, reaching 6.5M units sold in 2022, but then unexpectedly fell by -10% to 2024. 2025 has seen the start of a recovery, with sales rising 4%…
-
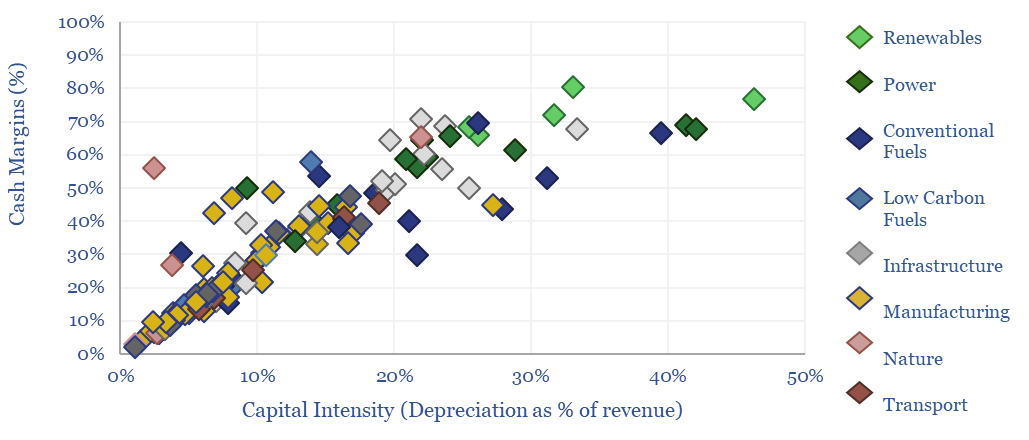
Energy economics: an overview?

This data-file provides an overview of energy economics, across 175 different economic models constructed by Thunder Said Energy, in order to put numbers in context. This helps to compare marginal costs, capex costs, energy intensity, interest rate sensitivity, and other key parameters that matter in the energy transition.
-
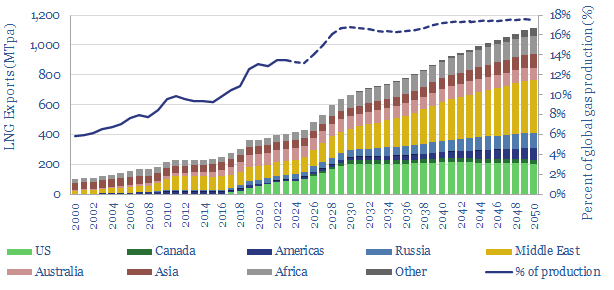
LNG: top conclusions in the energy transition?

Thunder Said Energy is a research firm focused on economic opportunities that drive the energy transition. Our top ten conclusions into LNG are summarized below, looking across all of our research.
-
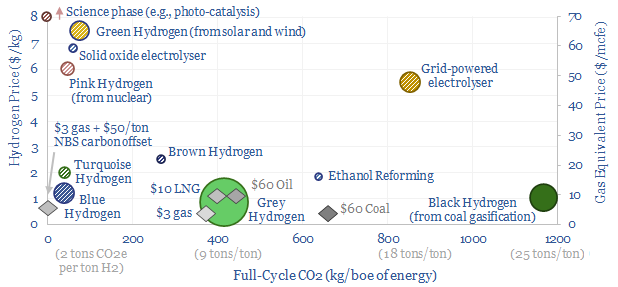
Hydrogen: overview and conclusions?

We think the best opportunities in hydrogen will be to decarbonize gas at source via blue and turquoise hydrogen, displacing ‘black hydrogen’ that currently comes from coal, and to produce small-scale feedstock on site via electrolysis for select industries. Others see green hydrogen as a cornerstone of the future energy system. We think there may…
-
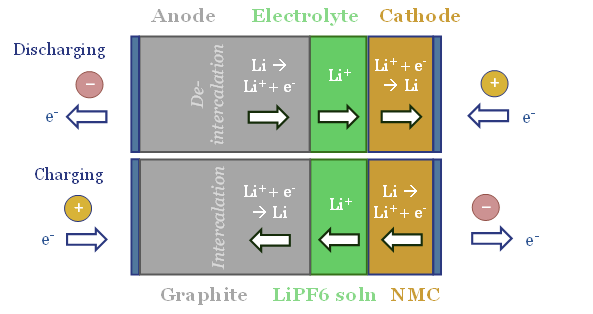
Energy storage: top conclusions into batteries?

Thunder Said Energy is a research firm focused on economic opportunities that can drive the energy transition. Our top ten conclusions into batteries and energy storage are summarized below, looking across all of our research.
-
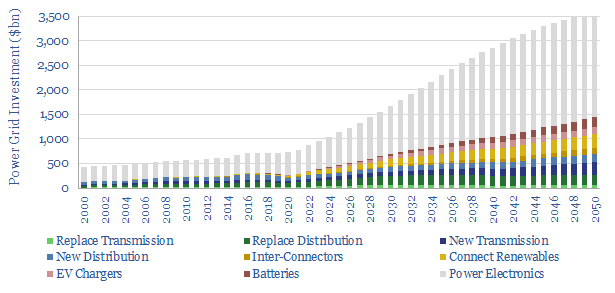
Power grids: opportunities in the energy transition?

Power grids move electricity from the point of generation to the point of use, while aiming to maximize the power quality, minimize costs and minimize losses. Broadly defined, global power grids and power electronics investment must step up 5x in the energy transition, from a $750bn pa market to over $3.5trn pa. But this theme…
-
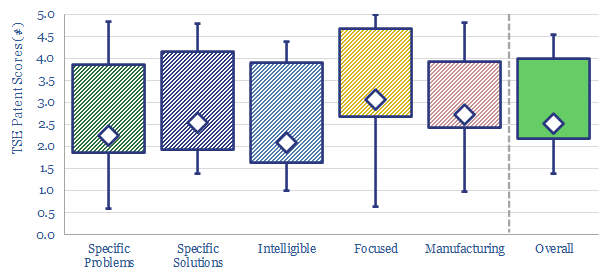
TSE Patent Assessments: a summary?

This data-file aggregates all of our patent assessments into a single reference file, so different companies’ scores can be compared and contrasted. Our average score is 3.5 out of 5.0. Skew is to the downside. Intelligibility is the biggest challenge. Scores correlate with TRL and revenues.
-
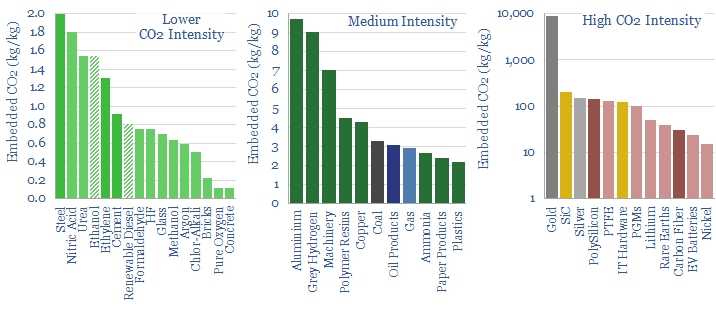
CO2 intensity of materials: an overview?

This data-file tabulates the energy intensity and CO2 intensity of materials, in tons/ton of CO2, kWh/ton of electricity and kWh/ton of total energy use per ton of material. The build-ups are based on 160 economic models that we have constructed to date, and simply intended as a helpful summary reference. Our key conclusions on CO2…
Content by Category
- Batteries (96)
- Biofuels (44)
- Carbon Intensity (48)
- CCS (64)
- CO2 Removals (9)
- Coal (41)
- Commentary (65)
- Company Diligence (104)
- Data Models (921)
- Decarbonization (162)
- Demand (129)
- Digital (86)
- Downstream (47)
- Economic Model (220)
- Energy Efficiency (76)
- Hydrogen (63)
- Industry Data (308)
- LNG (56)
- Materials (86)
- Metals (88)
- Midstream (45)
- Natural Gas (161)
- Nature (76)
- Nuclear (28)
- Oil (175)
- Patents (39)
- Plastics (44)
- Power Grids (155)
- Renewables (153)
- Screen (137)
- Semiconductors (35)
- Shale (58)
- Solar (72)
- Supply-Demand (53)
- Vehicles (95)
- Video (24)
- Wind (47)
- Written Research (406)