Smooth operators: who benefits from volatile power grids?

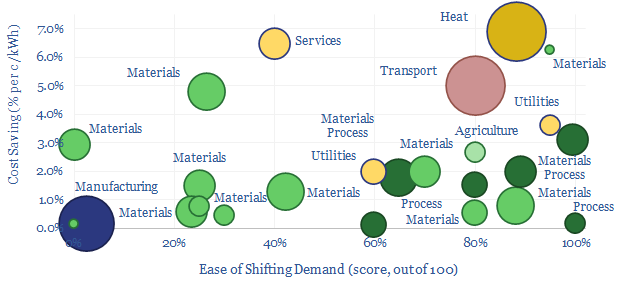
Some industries can absorb low-cost electricity when renewables are over-generating and avoid high-cost electricity when they are under-generating. The net result can lower electricity costs by 2-3c/kWh and uplift ROCEs by 5-15% in increasingly renewables-heavy grids. This 14-page note ranges over 10,000 demand shifting opportunities, to identify five industries and fifteen mid-large cap companies that can benefit most.


Power grids are changing with the ramp-up of wind and solar. In particular, power pricing is becoming more volatile, potentially falling near to zero in the windiest and sunniest moments, then spiking to 2-3x normal levels during times of shortages. When input pricing becomes more volatile, there are inevitably winners and losers, as illustrated on pages 2-3.

Different types of power grid volatility range from instant-to-instant, through to year-to-year. But the best economic opportunities for demand shifting, we think, range from minute-by-minute through to several days (pages 3-4).

10,000 fold complexity. If you think that the different forms of renewables volatility are complex, then you also need to overlay four different types of demand shifting, available in 300 industries globally, each with 3-30x sub-processes. Complexity “is what it is”. In our view, it is also the reason that demand shifting opportunities have been overlooked and under-discussed as part of other energy transition roadmaps (page 5).

Our goal in this note is to defray the complexity, by drawing on five years of research. We start by laying out a five point framework, which we will use to assess which industries are well-placed for demand shifting, to lower their costs and uplift their margins in more volatile power grids (page 6).

What is the answer? We have spent the last five years, building over 160 economic models, and studying different industrial processes. The goal in this note is not to re-hash all of the workings, which are available to all TSE subscription clients, but simply to present the answers. Which industries and companies will benefit most from demand shifting, as power grids become more volatile? Where? And how much?

Five industries that seem best placed to us to benefit from grid volatility are discussed on pages 10-14. We also note 15 leading, mid-large cap companies across these industries.

Some of these companies have already created internal departments to optimize the timing of their power demand, smooth out renewables and deflate their electricity costs in the process. We will also continue expanding and updating the underlying data-file here.

Global decarbonization: speeding up or slowing down?

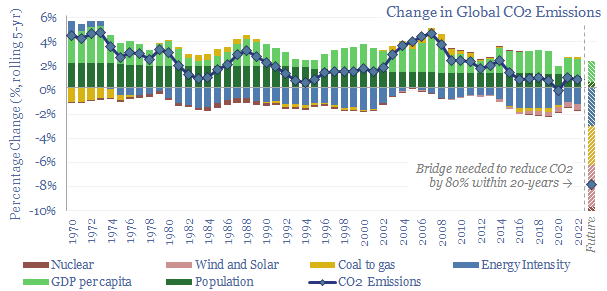
This 16-page report breaks down global CO2 emissions, across six causal factors, and 28 countries/regions. Global emissions rose at +0.7% per annum (pa) from 2017-2022, of which +1.0% pa is population growth, +1.4% pa rising incomes, -1.4% pa efficiency gains, -0.5% renewables, 0% nuclear, +0.2% ramping back coal due to underinvestment in gas. Depressingly, progress towards net zero slowed in the past five years. Reaching net zero requires an ‘all of the above’ approach, accelerating renewables, clean infrastructure, efficiency, nuclear, gas, CCS and nature.


Global CO2 emissions exceeded 50GTpa in 2022, having doubled over the past half century, and still rising at +0.7% per year in the past five years from 2017 to 2022. These numbers are broken down by region on page 2.

Global CO2 emissions (in GTpa) can also be explained via a factor attribution: multiplying population (M people) x GDP per capita (in $k per person) x energy intensity of GDP (in MWH per $k) x share of energy from combustion sources (rather than renewables) (in %) x CO2 intensity per unit of combustion energy (in kg/kWh). The same maths works on the deltas. And region by region. Our methodology is explained on pages 3-4.

Over the past five years, global CO2 emissions have risen at a +0.7% CAGR, which attributed to +1.0% pa population growth, +1.4% pa GDP per capita, -1.4% pa efficiency gains, -0.5% pa due to the ramp up of wind and solar, but +0.2% pa due to the switching back from lower-carbon to higher-carbon hydrocarbons. We highlight some key conclusions and forecasts on each of these attribution categories on pages 5-7.

Chart after chart in the remainder of the report shows that where countries under-invested in gas and had to pivot back to coal, then CO2 emissions have risen; where nuclear plants have been shut down, then CO2 emissions have risen; where renewables investments and efficiency investments have slowed down, then CO2 emissions have fallen more slowly. This is just maths and history. Irrefutable maths and history.

The single most important point in the note is that an ‘all of the above’ approach is needed to have any mathematical hope of reaching net zero by 2050. It would be so strange and unnecessary to put all of our decarbonization eggs into a single basket.

Another historical observation is that switching coal to gas has been one of the most powerful decarbonization tools available. US CO2 emissions peaked in 2005 and have since fallen by c20%, of which 70% was switching coal to shale gas, saving over 750MTpa of CO2. UK CO2 emissions peaked in 1965 and have more than halved, of which 60% has been switching coal to gas, saving 300MTpa of emissions.

The report also focuses in upon: US decarbonization, which now leads the pack (page 7); UK decarbonization, which is the most depressing slowdown of any country in our sample (page 8); and Europe and Japan, a tale of two nuclear policies (page 9).

In the emerging world, which is the source of 70% of the world’s CO2 emissions, CO2 emissions rose at a +1.35% CAGR in the past five years from 2017-22. This is faster than the +1.29% CAGR from 2012-17. The biggest reason for the step up is that coal-to-gas switching was providing -0.2% pa of decarbonization in 2012-17, while underinvestment in gas caused a switch back to coal in 2017-22 (from 6.4GTpa to 6.9GTpa of coal use) and in turn this increased emissions by +0.4% pa. This was offset by a slower pace of income growth (from +2.7% pa in 2012-17 to +2.1% pa in 2017-22). It is hard not to be depressed when looking at these numbers (pages 10-11).

We also zoom in upon CO2 emissions trends, and their factor attributions in China, India, Brazil and Africa (pages 12-13).

Reforest and reinvest looks like a promising economic development model, which could uplift the GDP of 47 emerging world countries by 6-60% while creating a 7.5GTpa CO2 removals sink (note here).

In conclusion, it is mathematically quite challenging to bridge to net zero without an ‘all of the above approach’, which accelerates as many options as possible, including wind, solar, electrification, efficiency gains, gas, LNG, CCS, nuclear and nature-based solutions.

Hydrogen reformers: SMR versus ATR?

Hydrogen reformers

Blue hydrogen value chains are gaining momentum. Especially in the US. So this 16-page note contrasts steam-methane reforming (SMR) versus autothermal reforming (ATR). Each of these different hydrogen reformers has different merits and challenges. ATR looks excellent for clean ammonia. While the IRA creates CCS upside for today’s SMR incumbents, across industrial gases, refining and chemicals.


Low carbon hydrogen from natural gas seems to be gaining momentum since the start of 2023. In particular, we have been impressed by the opportunities and momentum in blue ammonia, blue steel, methanol and other chemicals, as re-capped on pages 2-3.

The thermodynamic advantages of producing hydrogen from methane versus water are not well appreciated. If you start with 1 ton of water and 1 ton of methane, then inject the same energy to each one, you could harness 7x more hydrogen from the methane (page 4).

Steam methane reformers are the dominant source of today’s industrial hydrogen market. SMRs derive 75% of their hydrogen from steam, 25% from methane. The seven-step process — along with detailed mass and energy balances at each stage — are on pages 5-6.

Can CO2 be captured from steam methane reformers? 60% of the total CO2 from SMRs is readily captured. But the remainder is mostly from burning PSA tail gas in external fire tubes, and much harder to sequester (page 7).

Autothermal reformers are an emerging reactor design for clean hydrogen, deriving 55% of the hydrogen from methane, 45% from steam. The same seven steps occur in an ATR as in an SMR, but with importantly different gas mixes at each stage, concentrating c90% of the CO2 so that it can readily be captured, as explained on pages 8-9.

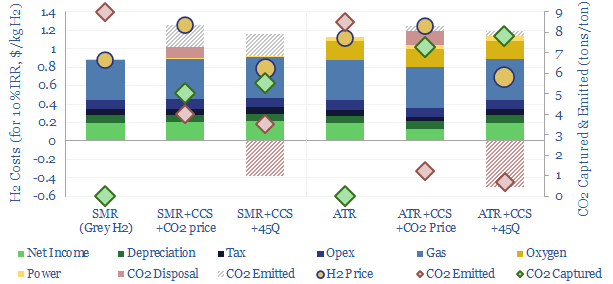
The costs of producing hydrogen are compared for SMRs and ATRs — including for different shades of grey hydrogen and blue hydrogen — on pages 10-11.

ATR has advantages and drawbacks, especially in particular chemicals processes, where oxygen feeds are more available. We think this will become a widely used reactor design for future clean hydrogen production. Please see page 12.

For incumbent SMRs, the US Inflation Reduction Act (IRA) is worded in a way that unlocks upside for industrial gas companies and refiners. We bridge to 20% IRRs for deploying CCS at existing SMRs (page 13).

Who benefits? The US’s 10MTpa hydrogen market is disaggregated here, facility by facility and operator by operator. Possible upside to free cash flow is discussed on page 14.

Leading companies in SMR and ATR reactor designs, including our conclusions from Topsøe’s ATR patents, plus six listed industrial gas and chemicals/engineering companies, are reviewed on pages 15-16.

Omniscience: how will AI reshape the energy transition?

AI reshape energy transition

AI will be a game-changer for global energy efficiency. It will likely save 10x more energy than it consumes directly, closing thermodynamic gaps where 80-90% of all primary energy is wasted today. Leading corporations will harness AI to lower their costs and accelerate decarbonization. This 19-page note explores opportunities for AI to reshape the energy transition.


How will AI reshape energy transition? What if AI achieved near ‘omniscience’, being able to solve any specific and solvable task that we set it? This 19-page report covers our conclusions for energy, industry and energy transition value chains.

AI will likely ramp up to consume 500 TWH of electricity, directly, by 2030, as covered in our overview of digital energy consumption (pages 2-3). This will create upside for global energy demand in the short-term.

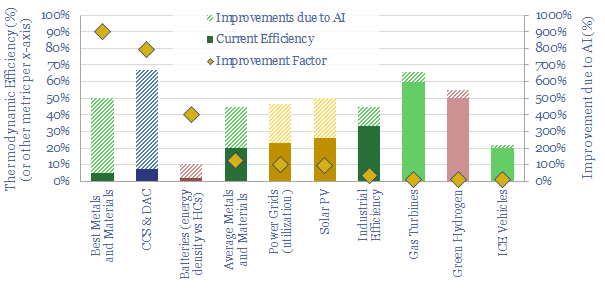
But 80-90% of primary energy is also wasted in today’s global energy system. And the main reason is a lack of knowledge and processing power. A key idea in the note is that AI will help to close these thermodynamic gaps. So where are those thermodynamic gaps greatest, and where can they be narrowed? (pages 2-3).

Rules of engagement. What is and what is not realistic for AI in the energy transition? We set out six rules for AI engines on page 4. Laws of thermodynamics, chemistry, physics are fairly immutable. Some problems are also better suited to AI than others.

How will AI improve industrial efficiency? The energy intensity of global GDP has improved at 1% per year since 1970 (data here, research controversies here). We see AI as sustaining this long-standing trend, maybe mildly accelerating it. This is exciting, but it is not the area that excites us most (pages 5-6).

How will AI improve materials value chains, which consume 40% of all the world’s energy and emit 35% of its CO2? The numbers here are enormous. Thermodynamic efficiency of materials production averages 20% globally (data here). For some processes, AI can unlock 10x gains, equating to 90% reductions in energy use per ton of output (pages 7-8).

How will AI improve the efficiency of heat engines? Next-generation material science can also boost efficiency of gas turbines and jet engines by around 5pp, mainly via improved materials (pages 9-10).

How will AI reshape renewables? We think the efficiency of solar can double again from here, and there are semiconductor technologies in conceptual state space that offer 50% solar efficiency, which is double today’s leading TOPCons (pages 11-12).

How will AI reshape power grids? Electricity rises from 40% of useful energy today to 60% by 2050 (note here). All else equal, this requires transmission infrastructure, distribution infrastructure and power grid capex to rise by 3-5x (note here). But we think AI can likely double the utilization rates of grid infrastructure (pages 13-14).

How will AI reshape CCS and DAC value chains? The thermodynamic efficiency of recently proposed CCS and DAC pathways are around 5-10%. The challenges for 60-90% efficient sorbents and membranes are very large, but so too is the state space of possible sorbents and membranes (pages 15-16).

How will AI reshape lithium-ion batteries, nuclear fusion, green hydrogen value chains or nature-based solutions. We found it harder to de-risk breakthroughs using AI in these areas, as explained on pages 17-18.

What are the best AI opportunities for companies and decision-makers in the energy transition? Our key conclusions are summarized on page 19.

Industrial gas separation: swing producers?

Pressure swing adsorption

Swing Adsorption separates gases, based on their differential loading onto zeolite adsorbents at varying pressures. The first Pressure Swing Adsorption (PSA) plant goes back to 1966. Today, tens of thousands of PSA plants purify hydrogen, biogas, polymers, nitrogen/oxygen and possibly in the future, can capture CO2? This 16-page note explores PSA technology, costs, challenges, leading companies and disruption of industrial gases.


Gas separations matter as many industrial processes require pure input streams. Industrial hydrogen must be purified from a soup of gases exiting a methane reformer. Polymers and other advanced materials require separating olefins from the outputs of crackers. Other important separations include air separation, gas processing and possibly also CO2 separations for CCS. Industrial examples are discussed on pages 2-4.

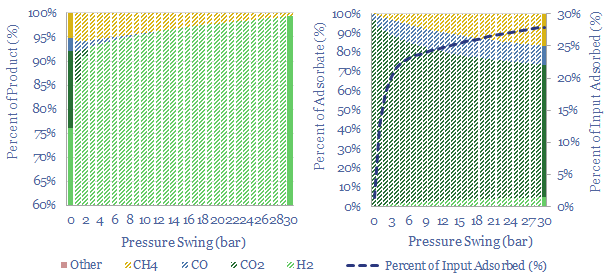
Pressure Swing Adsorption works by harnessing different products’ different affinities to adsorb onto zeolites at different pressures and temperatures. If you want to understand how much gas adsorbs onto a zeolite, we cover the basic theory of Langmuir Isotherms (pages 5-6), and more advanced models such as the Sips model (page 7).

Zeolites and activated carbon are two classes of materials that can be used as adsorbents. Zeolites are crystalline aluminosilicates. 40 occur naturally and 250 total structures have been synthesized (page 8).

Separating hydrogen from reformer gases? Separating hydrogen from SMR syngas might cost $0.06/kg for 95-99% pure H2, with 85-95% recovery, based on our PSA economic models. The breakdown of costs, and other sensitivities, are discussed on pages 9-10.

Separating biomethane from biogas? Separating biomethane from biogas and landfill gas could use pressure swing adsorption, but we find the thermodynamics and costs to be more challenging, per page 11.

Separating CO2 from exhaust gases? Separating CO2 from exhaust gases could use pressure swing adsorption, but we find the thermodynamics and costs to be even more challenging again, per page 12. Although this may change in the future, with next-gen adsorbents?

What excites us most about PSA is the possible energy savings compared to other separation technologies, and the growing capability to backstop volatile renewables (demand shifting). Compressors and vacuum pumps are simply more flexible than cryogenics, per pages 13-14.

Leading companies in Pressure Swing Adsorption are discussed on pages 15-16, including the usual suspects in Industrial Gases, and how many PSA plants they have constructed historically. PSA is especially important in future blue hydrogen value chains, from production to distribution (page 15).

Disruption of the air separation industry? There is also a stream of new entrants, including a large, listed Capital Goods giant, looking to use PSA for air separations, instead of cryogenics. Energy costs can be materially lower, and flexibility to backstop renewables can be materially higher, versus incumbent air separation technologies (page 16).

Pressure swing adsorption is an important tool for industrial separations, alongside amine separations, membrane separations and cryogenic separations, as covered in our broader research. For access to all of our research, please contact us about a TSE subscription.

Electric vehicles: breaking the ICE?

Electric vehicle outlook

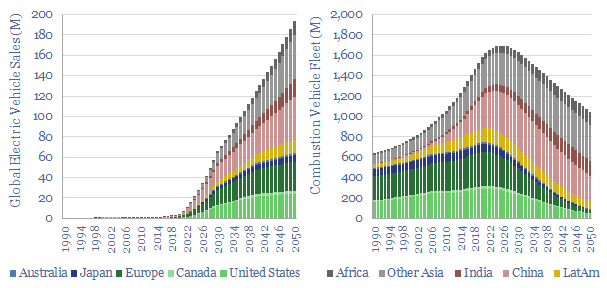
Electric vehicles are a world-changing technology, 2-6x more efficient than ICEs, but how quickly will they ramp up to re-shape global oil demand? This 14-page note presents our electric vehicle outlook and finds surprising ‘stickiness’. Even as EV sales explode to 200M units by 2050 (2x all-time peak ICE sales), the global ICE fleet may only fall by 40%. Will LT oil demand surprise to the upside or downside?


Global oil demand is seen plateauing at 103Mbpd through 2030, then declining to 85Mbpd as part of our roadmap to net zero, including a 65% reduction in light vehicle demand, from c40Mbpd to c15Mbpd. But what EV sales and ICE retirements are actually likely? (page 2).

Most of the technologies we have followed over the past five-years have gained traction more slowly than we might have naively expected, as discussed in our recent research note here, but we do see EVs ramping quickly and changing the world (page 3).

Today’s global vehicle fleet consists of 1.7bn light vehicles, as captured in our new model of global vehicle sales by region. Definitions and modelling assumptions are set out on pages 4-7.

Our base case model suggests that combustion vehicle sales already peaked at 94M in 2017 and fall two-thirds by 2050, while electric vehicle sales ramp to 65M in 2030 and almost 200M in 2050. As a result, the EV fleet overtakes the ICE fleet in 2043, while the ICE fleet peaks in 2026 and declines by 40% to 1bn combustion vehicles by 2050 (page 8).

Is this realistic? We think that these numbers are extremely generous to EVs, extremely harsh on ICEs, and if we had to guess, ICEs will surprise to the upside. Sensitivities and controversies are reviewed on pages 9-13.

Our electric vehicle outlook also requires overcoming bottlenecks in lithium, fluorinated polymers, battery-grade nickel, graphite, copper, Rare Earth Metals and SiC. Mechanically, you can also multiply the number of vehicles discussed in this note by the material balances in our battery models.

Our main conclusion from the modelling exercise in this research note is that even after moving Heaven and Earth to ramp up electric vehicle sales to 200M units per year by 2050, the world’s fleet of combustion vehicles will be surprisingly sticky. The value and opportunity for incumbent companies is also surprisingly sticky (page 14).

Energy technologies: the pace of progress?

energy technology development

This 12-page note looks back over 5-years of energy technology development. Progress has often been slower than we expected. Maturing early-stage technology takes 20-30 years. Progress slows as work shifts from the lab to the real world. We wonder whether 2050 will look more like 2023 than many expect, with more value for incumbents; or if decarbonization goals must rely more on today’s mature technologies?


This note looks back at 25 technologies, which we have written about and tracked since 2018. What has surprised us, maybe even depressed us, is how slowly many have progressed.

Energy technologies considered in the note include blue hydrogen, SiC power MOSFETs, hydrogen vehicles, TOPCon solar, remote working, plastic pyrolysis, post-combustion CCS, battery recycling, supercapacitors, aerial vehicles, Allam Cycle Oxy-Combustion, BECCS, direct air capture, airborne wind, metal organic frameworks, drones, molten carbonate fuel cells, deep geothermal, autonomous vehicles, chemical looping combustion, AI-supported concentrated solar, direct lithium extraction and nuclear fusion.

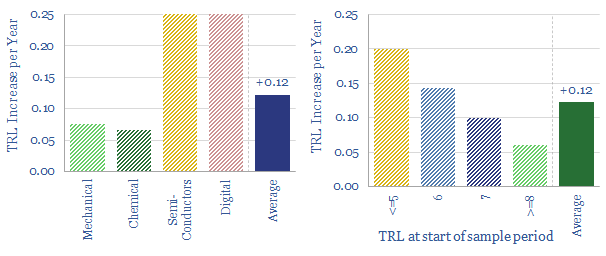
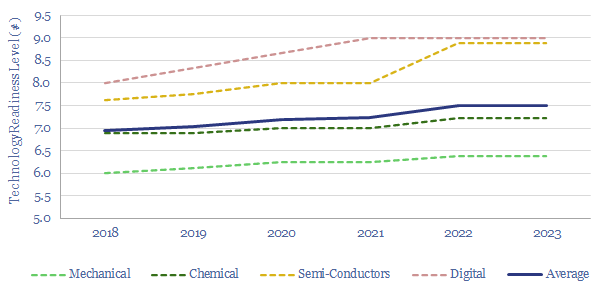
The average technology in our screen has only gained 0.12 rungs of the TRL ladder per year, especially mechanical-chemical technologies, at 0.07 rungs/year (chart below).

Semiconductor and digital technologies are an exception and have tended to progress around 3x faster than mechanical or chemical technologies; which augurs well for solar, EVs, electrification and digital technologies in the energy transition.

We wonder whether the media/markets are overly optimistic on energy technology development? Or whether investors are fairly compensated for technology risk? For example, if we look at companies that have folded in the last five years, we can often find scores of earlier media articles trumpeting them as “the next big breakthrough” or a “game changer for energy transition”.

More soberly, it may be a route to disappointment, maybe even financial distress, to assume a 5-7 year technology development cycle on an early-stage chemical-mechanical technology, encountering challenging real-world variability, and needing to construct large stick-built production facilities? Our analysis suggests these technologies more likely take 20-30 years to progress from early-stage technology to fully de-risked status.

More optimistically, this conclusion underlines the importance of considering energy economics, economic modelling and reviewing patents, in order to identify genuinely exciting technologies, which can overcome the inevitable roadblocks. There really are “technology breakthroughs” and “energy transition game-changers” out there.

Overall is there more persistent value in incumbents and in technically ready decarbonization solutions, such as natural gas, LNG and nature-based solutions?

Page 12 of the report is a five-point framework, which we have based on our findings in the report and our experiences over the past five years, to help decision makers de-risk the route to maturity for emerging technologies. We hope this is useful, and will be using this framework when assessing new energy technologies in our future research.

Industrial gases: out of thin air?

industrial gases

Cryogenic air separation is used to produce 400MTpa of oxygen, plus pure nitrogen and argon; for steel, metals, ammonia, wind-solar inputs, semiconductor, blue hydrogen and Allam cycle oxy-combustion. Hence this 16-page report is an overview of industrial gases. How does air separation work? What costs, energy use and CO2 intensity? Who benefits amidst the energy transition?


As compressed gases expand, they will tend to cool down, via the Joule Thomson effect. We think it is helpful for energy decision-makers to understand this theme, as it underpins fridges, air conditioners, heat pumps, LNG and industrial gases.

Industrial gases comprise a market worth c$100bn per year, including 400MTpa of oxygen. And a surprisingly large number of metals, materials and decarbonization technologies use industrial gases. For example, blue hydrogen ATRs and Allam Cycle oxy-combustion are both oxygen-fired. An overview of industrial gas demand is given on pages 2-3, and demand from new energy transition technologies is reviewed on page 4.

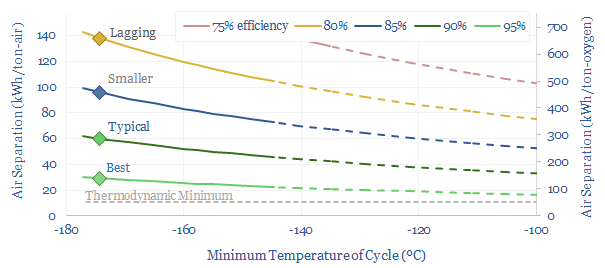
The thermodynamic minimum energy demand to separate oxygen from air is 51 kWh/ton. But how realistic is it that real-world processes will ever reach this theoretical level? Our answer is on page 5.

Real world cryogenic processes achieve cryogenic air separation via the Reverse Brayton Cycle. We explain how this thermodynamic cycle works on page 6, and quantify real-world energy costs (in kWh/ton) from first principles on page 7.

Air Separation Unit (ASU) designs are reviewed on pages 8-9, including the key components of real-world plants, and what determines their capex (in $/Tpa).

Costs of industrial gases are discussed on pages 10-11, including our best estimates of base case IRRs (%), costs of different gases (in $/ton) and the cost drivers. Raising energy is often possible, but not always economical. And can ASUs ‘demand shift‘, backstopping renewable heavy grids like batteries, by scaling up and down to smooth out an increasingly volatile power grid?

What implications for blue hydrogen, green hydrogen, Allam Cycle oxy-combustion, direct air capture energy economics? Some important conclusions are noted on page 12.

Leading companies in industrial gases are discussed on pages 13-14. Our company screen is linked here. We wonder whether reliability, scale and quality lead to sustainably higher margins?

Power grids: down to the wire?

Power grid metals demand

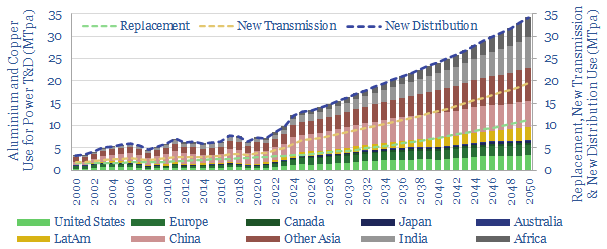
Power grid circuit kilometers need to rise 3-5x in the energy transition. This trend directly tightens global aluminium markets by over c20%, and global copper markets by c15%. Slow recent progress may lead to bottlenecks, then a boom? This 12-page note quantifies rising power grid metals demand, demand for circuit kilometers, and who benefits?


Power grids have recently used 5-6MTpa of aluminium (8% of demand) and 3MTpa of copper (10%), as global electricity demand has risen by +630 TWH pa globally over the past 20-years. The purpose of this report is to estimate future power grid metals demand.

How much growth for power grids? To derive our estimates, we have quantified (and multiplied) future electricity demand in TWH (page 2), power grid circuit kilometers per TWH of electricity (page 3) and tons of metals use per circuit kilometer (page 4).

Trends in the energy transition increase power grid aluminium and copper demand even further. Including utilization factors in the transmission network halving due to volatility of wind and solar (page 5), rising remoteness (page 6) and more metals-intensive electricity use, especially for electric vehicle chargers (page 7).

There is upside for metals in energy transition power grids, but we think that the growth in power cable demand is more likely to stoke aluminium than copper. Leading global copper producers and leading global aluminium producers are discussed on pages 8 and 9.

Circuit kilometers needed for power grids in the energy transition are estimated by region on page 10, and the underlying data-set is here. While demand for power grid metals rises by 15-20%, demand for power cables rises 4x. Leading cable producers are also discussed on page 10.

Will power grids present a bottleneck for the rise of wind and solar? We review some evidence on page 11, and discuss implications for rising returns at listed transmission and distribution utilities on page 12.

Magnets and energy: fundamental attraction?

Overview of magnets

Electric currents create magnetic fields. Moving magnets induce electric currents. These principles underpin 95% of global electricity. Plus 50% of wind turbines and over 90% of electric vehicles use permanent magnets with Rare Earth metals. This 15-page overview of magnets covers key concepts and controversies for the energy transition.


What is a magnet? There are 650-page textbooks seeking to answer this question. Our goal in this research note is to distil all of the key concepts for magnets in the energy transition, into just 15 highly concise pages, and starting from first principles.

A magnet is a source of potential energy with potential to exert forces on moving charges. We explain the key formulae for magnetic forces on pages 2-3, covering magnetic fields (m3), magnetic flux (Webers) and magnetic flux density (Teslas).

Magnets are the basis for all electric motors and over 95% of today’s global electricity generation, via moving magnets in rotors and magnetic induction in stator arrays. Even basic units of energy, electricity and thermodynamics tie to magnetic units (pages 4-6).

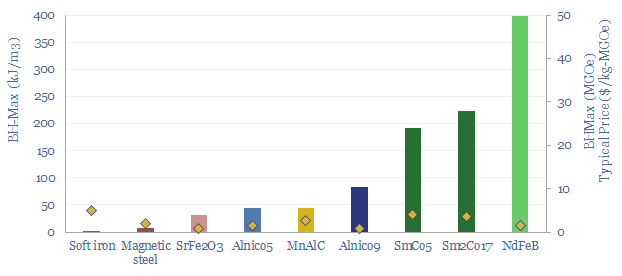
Magnetic properties that matter most for practical applications are remanent magnetic flux density (Teslas), coercivity (kA/m) and maximum energy product (J/m3, or Mega-Gauss Oersteds (MGOe)). We explain these variables, and why they matter on page 7.

Electromagnets are widely used in stationary power generation and large motors, using soft metals with low coercivity and low remanent flux densities. We cover the key materials, advantages and disadvantages on page 8.

Permanent magnets using different Rare Earth materials are compared and contrasted. Their properties hinge on quantum physics. Which sounds Academic. But it is important to understand why NdFeB will be hard to displace. And we promise that pages 9-10 are surprisingly readable, despite venturing into the murky quantum realm.

Global electricity will surpass 30,000 TWH for the first time in 2023, and the CAGR for global electricity demand steps up from 2% pa to 4% pa in the energy transition. Substantively all electricity in the world is produced by magnets, and the remainder is produced by semiconductor. Implications for magnets, and vice versa, are discussed on page 11.

Wind power uses a balance of electromagnets in doubly fed induction generators and increasingly, permanent magnets. Our key conclusions on the relative merits are on page 12.

Electric vehicle sales need to ramp up by another 20x in our roadmap to net zero. A key debate, pace Tesla, is whether efficient and long-range electric vehicles will need to continue using Rare Earth magnets containing neodymium, dysprosium, terbium, praseodymium (page 13).

Leading companies in permanent magnet value chains include recent acquisitions from large private equity firms, listed Asian pure plays, and industrial conglomerates. We have summarized some of these companies and recent industry trends on pages 14-15.

Copyright: Thunder Said Energy, 2019-2024.