Post-combustion CCS: what energy penalties?

CCS energy penalties

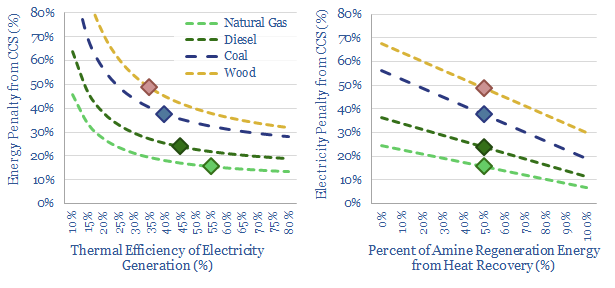
A thermal power plant converts 35-45% of the chemical energy in coal, biomass or pellets into electrical energy. So what happens to the other 55-65%? Accessing this waste heat can mean the difference between 20% and 60% energy penalties for post-combustion CCS. This 10-page note explores how much heat can be recaptured.


What are CCS energy penalties? We define CCS energy penalties as the loss of useful energy across an end-to-end CCS value chain, versus the useful energy that would have been available without using CCS. They include direct electricity use (e.g., for CO2 compression in pipelines and disposal facilities). And they include thermal loads in the amine reboiler, absorbing heat that could otherwise have driven the power cycle. We give our best estimates for all of these variables (in kWh and in percent) on pages 2-3.

How much waste heat can be harnessed? If a coal plant can meet all of its amine reboiler duty using waste heat, which would otherwise simply have condensed in a cooling tower, then its CCS energy penalties are as low as 20%. If it needs to burn extra coal to meet all of its amine reboiler duty, then CCS energy penalties are as high as 60%. So how much waste heat can be harnessed at a solid fuel power plant?

A typical thermal power plant must already be recapturing 50-70% of its theoretically available waste heat if it is achieving a thermal efficiency in the range of 30-45%. We show this by modelling a thermal power plant, first with no heat recapture on page 4, and then adding in the efficiency impacts of modern coal power plant design on pages 5-6. This allows us to quantify how much waste heat is still available in kWh/ton.

What are the CCS energy penalties for biomass power? The same discussion applies to biomass-fired power plants as to typical thermal power plants. We have adjusted for the heat content of fuels, and a few other tweaks, to quantify how much waste heat is available, in kWh/ton at a typical biomass pellet power plant (page 7).

But is this waste heat really available to defray CCS energy penalties? We consider the IRRs on additional heat exchangers, organic Rankine cycles and supplying medium-temperature water for district heating on pages 8-9. This analysis suggests that most power plants will have already grasped options for heat recovery that are practical?

CCS is increasingly being explored due to $85/ton incentives, made available under the US Inflation Reduction Act. However, we end the note on page 10, by wondering whether simple, flat $85/ton CO2 prices could have unleashed a very large amount of efficiency gains at power plants that happened to have large waste heat streams.

Blue steel: construction boom?

DRI+EAF steel

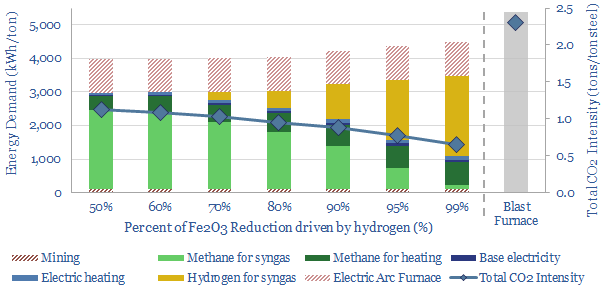
The DRI+EAF steel pathway already underpins 6% of global steel output, with 50% lower CO2 than blast furnaces. But could IRA incentives encourage another boom here? Blue hydrogen can reduce CO2 intensity to 75% below blast furnaces, and unlock 20% IRRs at $550-600/ton steel? This 13-page report explores the opportunity, and who benefits.


A blue process reduces the CO2 intensity of a value chain, usually by over 50%, often over 90%, by pairing it with some form of CCS (page 2).

Most famous are blue hydrogen and blue ammonia. Both currently seem to be booming in the US, following new incentives in the Inflation Reduction Act (IRA). And we think there are five factors underpinning these booms (page 3).

What about blue steel? This 13-page report argues that the same five factors exist for ‘blue steel’ as for blue hydrogen and blue ammonia. The goal of the report is not to assess all 80 different decarbonization pathways for all 500 different types of steel. But to zoom in on a particular pathway that looks particularly interesting to us in the 2020s (page 4).

Existing markets are one of our five factors. Global steel production has risen by 10x since 1950, to 2GTpa by 2022, and demand is still rising at 2.5% per year since 2012. 70% of steel is made in blast furnaces and basic oxygen furnaces, in a pathway that emits over 2 tons of CO2 per ton of finished steel (model here) (page 5).

Technological maturity is another factor. DRI+EAF is an alternate steel-making pathway, which already underpins 120MTpa of global steel production. This is 6% of the world’s steel output (which seems like a small amount, but for comparison, it represents about 5x more production than the world’s entire global supply of copper!) (page 6).

DRI+EAF steel. What are the costs and CO2 intensity factors? We have modeled the DRI pathway converting iron ore (Fe2O3) into direct reduced iron using a syngas of H2 and CO derived from natural gas. The DRI is then flowed through to an electric arc furnace (page 7).

Costs of DRI+EAF steel are competitive with blast furnace steel, but CO2 intensity is 50% lower. The drivers of the varying CO2 intensities are discussed on page 8.

Hydrogen blending. The reducing agents in DRI are mixtures of H2 and CO, formed by reforming natural gas. But the higher the share of hydrogen, the lower the CO2, and thus there is opportunity to add merchant hydrogen to DRIs. Existing DRIs might purchase 20-60kg/ton of merchant blue hydrogen to decarbonize steel (page 9).

Interesting economics? The most important part of the report looks at the economics of DRI+EAF facilities with very heavy levels of hydrogen blending, and thus very low CO2 intensities, around 75% below blast furnace steel. We think that sourcing $1/kg blue hydrogen as a reducing agent is already cost competitive (i.e., before subsidies). But IRA incentives, high energy prices in Europe, and ultimately border taxes uplift these IRRs to around 20% (pages 10-11).

Who benefits? Greater deployment of DRIs fed by blue hydrogen would also expand the market opportunity available to the usual suspects in hydrogen value chains. But we also see interesting wheels in motion in the steel industry. Five companies are discussed on pages 12-13.

Super-alloys: what role in energy transition?

Super-alloys role in energy transition

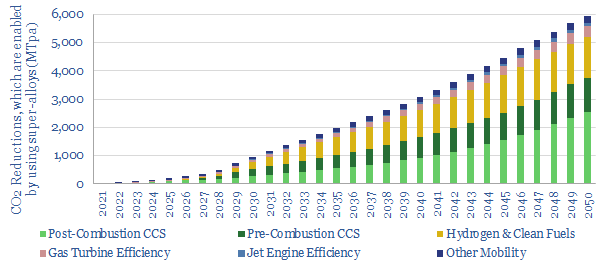
Super-alloys have exceptionally high strength and temperature resistance. They help to enable 6GTpa of decarbonization, across efficient gas turbines, jet engines (whether fueled by oil, hydrogen or e-fuels), vehicle parts, CCS, and geopolitical resiliency. Hence this 15-page report explores nickel-niobium super-alloys’ role in energy transition.


Super-alloys are blends of metals, with crystal structures that confer high strength, high temperature resistance, and/or resiliency to oxidation and corrosion. As rules-of-thumb, super-alloys can withstand 1,000MPa of stress at room temperature, and still withstand 500MPa of stress even as temperatures surpass 1,000ºC. These material properties are explained on pages 2-3.

Gas turbines and jet engines use super-alloys for greater efficiency, which is directly linked to turbine inlet temperatures, thanks to the physics of the Brayton Cycle (note here). Super-alloys are currently being developed that could improve efficiency by 5-7pp. Opportunities and implications are discussed on pages 4-5.

Pipelines, especially CCS pipelines, will blend in traces of super-alloys, so that they can flow greater volumes at higher pressures. Materials typically only comprise 10-30% of the costs of pipelines, so it makes economic sense to up-spec materials. Barlow’s Formula and other economic considerations are on pages 6-7.

Other deployments of super-alloys will enable decarbonization themes such as more efficient vehicles (page 8), clean fuels such as hydrogen or blue ammonia (page 9), and around half of the market is currently linked to aerospace and defense spending, which matters for geopolitical security? (page 10).

Super-alloys role in energy transition. How are super-alloys made, what do they cost, and what is their CO2 intensity? The note focuses upon nickel value chains and niobium. We have condensed the most important considerations onto pages 11-12.

Leading companies in super-alloys are concentrated across a handful of specialists. Some are divisions of large industrial conglomerates, and others are pure-plays. Names that stood out in our screens are summarized on pages 13-15.

What is the energy consumption of the internet?

Energy consumption of the internet

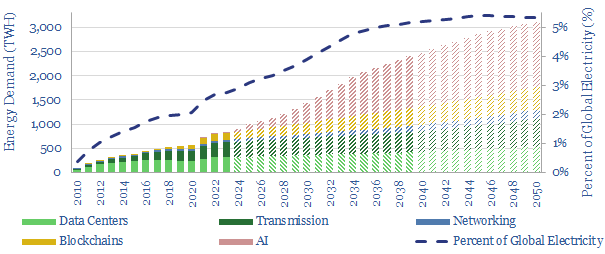
Powering the internet consumed 800 TWH of electricity in 2022, as 5bn users generated 4.7 Zettabytes of traffic. Our best guess is that the energy consumption of the internet will double by 2030, including due to AI (e.g., ChatGPT), adding 1% upside to global energy demand and 2.5% to global electricity demand. This 14-page note aims to break down the numbers and their implications.


Global energy demand is a crucial debate. We expect 60% upside in useful global energy demand by 2050 (model here), while some commentators expect declines. And nearer term, we think the world could be gripped by energy shortages (note here, model here) (page 2).

Hence the energy consumption of the internet matters. In 2021, there were 4.9bn internet users globally, underpinning 3.4 Zettabytes of internet traffic. The energy footprint of the internet has most likely doubled since 2015 to 800TWH in 2022, as internet traffic has risen at a 30% CAGR (page 3).

Why does the internet consume energy? We have aimed to explain the end-to-end drivers of energy consumption, including data servers in data centers (page 4) and transmission and networking (page 5).

It is a minefield. Different studies disagree by five orders of magnitude over the energy intensity of internet processes. We offer some perspectives around why this is, and how we get comfortable making approximate estimates for the future (6-8).

Future energy demand of the internet could double by around 2030, and reach 5% of global electricity use by 2050. We spell out our models and the numbers that we have pencilled in, including for the rise of AI engines (e.g., ChatGPT) on page 10.

Uncertainty is high. When we consider how the internet has evolved in the past, and the way it might evolve in the future, it makes a mockery of the idea that future global energy demand is knowable a priori. It is a very brave policymaker that plans their future grid, the energy security of their nation, around the notion that future demand will decline (page 11).

Counterfactuals. The internet not only consumes energy. It also displaces energy. Especially oil product energy, which is electrified. Some favorite examples are quantified on page 12. And impacts on our oil models are discussed on page 13.

Company implications: another very hungry caterpillar? The energy upside for the internet is all electricity. Moreover it is high quality electricity. So once again our conclusion is that all roads lead to power electronics. A few pure-play listed equities that stood out in our work, and interesting private equity ideas, are noted on page 14.

Blue ammonia: options strategy?

Blue ammonia

Blue ammonia can economically decarbonize the fertilizer industry, using low-cost natural gas; with options to decarbonize combustion fuels in the future. This 12-page report covers where we see the best opportunities, as reforms to the 45Q have already kick-started a 20MTpa boom of new US projects.


The pathway to producing blue ammonia is technically ready, scalable, and has just received an enormous boost, as reformed US 45Q regulation offers $85 per ton of CO2 that is captured and sequestered. This report argues blue NH3 can economically decarbonize the global fertilizer industry, with possible options to decarbonize some fuels in the future.

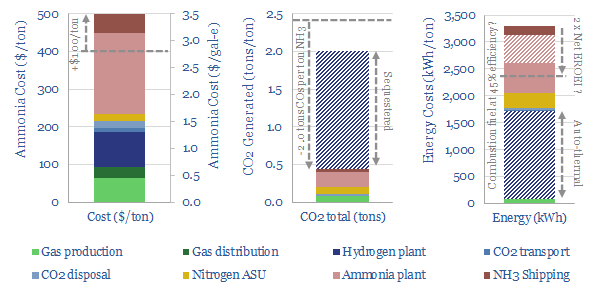
The end-to-end value chain is described on pages 2-3, aggregating across our models of gas production, gas distribution, hydrogen production, nitrogen production, ammonia synthesis, CO2 transportation, CO2 disposal and ammonia shipping. Hence we can estimate the costs (in $/ton), CO2 intensity (tons/ton) and energy costs (kWh/ton).

Option #1 for blue ammonia is to sell this feedstock, and its derivatives, into a growing global fertilizer market. This is our favorite option, for reasons outlined on pages 4-5.

Option #2 for blue ammonia is to blend NH3 into existing burners and boilers. There is no CO2 released when NH3 is burned, but there is CO2 embedded in the production and distribution of blue ammonia. CO2 abatement costs are calculated versus oil products, coal, gas and LNG on page 6. We argue this is more of an “option” than a mass-scale decarbonization opportunity, fit for specific contexts, at specific times, per page 7.

Option #3 for blue ammonia is to displace other liquid fuels, especially as a marine fuel. We think this option is going to be more challenging, and slower to emerge, for the reasons on page 8.

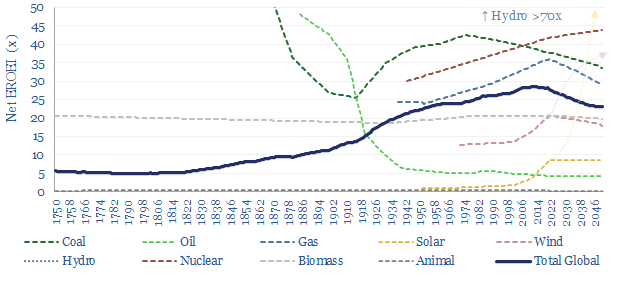
Darker thoughts. The net EROEI of the global energy system has risen steadily for 300-years, to current levels around 28x, per our note here. From an EROEI perspective, investing $50bn into producing blue ammonia does not allay our fears over mounting global energy shortages (pages 9-10).

Where are the best projects? We have screened a 30MTpa global pipeline of blue ammonia projects. We propose five rules of thumb to identify the best projects (page 11). And we also discuss some leading examples from our database, including the underlying companies, both project sponsors, services, and technology providers (page 12).

Energy macro: our top ten charts?

Predictions for global energy in 2023

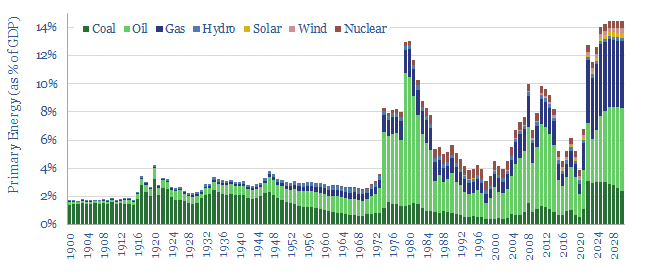
Is the global energy system on the precipice of persistent shortages, and record prices, in the mid-late 2020s? We worry that cumulative under-investment in the global energy system has now surpassed $1trn since 2015, relative to our energy transition roadmap. Our top ten slides into global energy ‘macro’ are set out in this presentation.


2022 saw the joint highest energy prices on record, matching the peaks of the 1979-80 oil shock ($100/bbl Brent, $6.5/mcf Henry Hub, $40/mcf European gas, $18/mcf LNG, $385/ton Australian coal).

Our best guess is that 2023 will bring weak macro conditions, as high inflation and rising interest rates ripple through the financial system. This will temporarily mute energy demand and prices. In turn, this will result in even further under-investment.

Thus as demand recovers in the mid-late 2020s, will the recent trends result in energy shortages and record energy prices in order to destroy unsatisfiable demand?

The purpose of this ten-page presentation is to weigh up the evidence around these energy-related anxieties.

The outlook covers surprising coal upgrades, an interpretation of record oil demand, LNG tensions, wind and solar upside vs bottlenecks, combustion energy capex trends, an estimate of global energy under-investment since 2015, our latest energy supply-demand balances, debates over supply growth, and debates over demand destruction.

Membranes for carbon capture: separation anxiety?

membranes for carbon capture

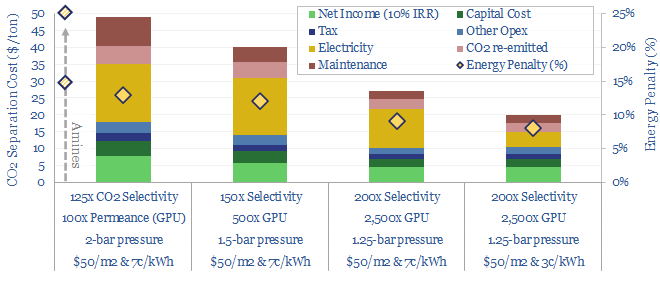
Next-generation membranes for carbon capture could separate out 95% of the CO2 in a flue gas, into a 95% pure permeate, for a cost of $20/ton and an energy penalty below 10%. This is better than the best amines. Hence our 15-page note lays out ten key questions, to help decision makers de-risk next-generation CCS membranes. The technology is early-stage. Companies are also noted.


CCS denotes any energy technology that prevents CO2 from combustion being released into the atmosphere. Our roadmap to net zero assumes 6 GTpa of CCS by 2050, of which half, or 3 GTpa is conventional CCS, largely using the amine process. Typical costs and energy penalties of the amine process are benchmarked on page 2.

The simplest separation membranes are molecular sieves, with tiny holes, at the exact right size, so one gas will pass through the membrane (permeate) and other gases will not (retentate). There are already ‘hundreds’ of deployments for CO2/CH4 separations in the gas industry. But membrane CCS require more than simple molecular sieving (page 3).

CCS membranes are envisaged to perform a kind of magic, achieving >100x more selectivity for CO2 than other similarly-sized gas particles, by harnessing differences in their solubilities, diffusivities and other physio-chemical interactions with the membrane (pages 4-5).

The goal of this research note is to avoid writing a long, boring textbook; and instead to frame ten key questions, which decision makers can keep in mind, if they are appraising next-generation membranes for CCS. I.e., what kinds of numbers start to get exciting, across the key dimensions, to unlock $20-50/ton separation costs (model here).

Important dimensions for CO2 separation membranes include selectivity (pages 4-5), gas permeance (page 6), compression energy (page 7), membrane costs (page 8), membrane processability (page 9), membrane stability (page 10), resistance to impurities (page 11).

The pathway to commercialization is discussed on pages 12-13, including our observations about the competitive landscape. While membranes for carbon capture are an exciting future technology, we are not de-risking them yet in our roadmap to net zero.

Next-gen membrane companies that have crossed our screens are profiled on pages 14-15. This includes growth stage companies, building on their experiences with gas/petrochemical membrane separations. Surprisingly, it also includes a Japanese materials large-cap. And on the other end of the spectrum, early-stage spin-outs from Academia.

As always, please contact us if we can help you explore any other companies in this interesting, and fast-evolving universe of membranes for carbon capture. We hope this report is a useful reference for decision-makers appraising the space. All of our CCS research to-date is linked on our CCS category page.

EROEI: energy return on energy invested?

Energy return on energy invested

Net energy return on energy invested (EROEI) is the best metric for comparing end-to-end energy efficiencies. Wind and solar currently have EROEIs that are lower and ‘slower’ than today’s global energy mix; stoking upside to energy demand and capex. But future wind and solar EROEIs could improve 2-6x. This will be a make-or-break factor determining the ultimate share of renewables?

This 13-page report quantifies net EROEIs, draws five conclusions for the energy transition, and explores how much wind and solar EROEIs could improve over time?


Energy efficiency matters because it determines how much primary energy needs to be supplied, in order to meet the ultimate energy demands of human civilization. If energy efficiency surprises to the upside, then the demand for coal, oil and gas will surprise to the downside. Or vice versa. We are worried that over-optimistic assumptions about future energy efficiency gains will culminate in energy shortages (here, here and here) (page 2).

So what is the ‘efficiency’ of wind or solar? Maybe 80-90%? The question is more complicated than it sounds. For a heat engine, efficiency is easily calculated by dividing electrical energy outputs by fuel energy inputs. But for a wind or solar asset, there is no fuel input. We are harnessing something that would otherwise have dissipated (page 3).

Net energy return on energy invested is the best way to compare total life cycle efficiencies of different energy sources, apples-to-apples. For example, it takes 100kWh of energy inputs to mine 1 ton of coal, which contains 6,500 kWh of thermal energy (65x gross EROEI), and then yields 4,000 kWh of useful heat and power (40x net EROEI) (page 4).

Renewables today. Our best estimates are that the net EROEI for wind today is around 23x and the net EROEI for solar today is around 12x. It has taken us about four years to build up these numbers, across dozens of different economic models. Of course, the numbers vary case by case, especially based on where these renewables are deployed (page 5).

There are five key conclusions from net EROEI. Renewables have net energy returns on energy investment that are ‘lower and slower’ than today’s blended average global energy, especially coal and gas (page 6), which is not the end of the world (page 7), but does mean the scale-up of wind and solar produces some questionable reversals of 300-year mega-trends (page 8), global energy demand is likely to surprise to the upside (page 9) and global energy capex must treble to $4trn per year (page 10).

The most interesting prospect for renewables to take greater share of the future energy mix, and overcome some of the issues above, is to improve their net EROEIs. Could solar ultimately surpass the net EROEI of coal and gas by over 2x? There is historical precedent for fundamentally new energy technologies to improve over time, looking back at the development of steam cycles, early electrical generators, gas turbines (chart below). Improving net EROEIs may determine the ultimate share of renewables in the future energy system? (pages 11-13).

CCS challenges: by any amines necessary?

CCS challenges

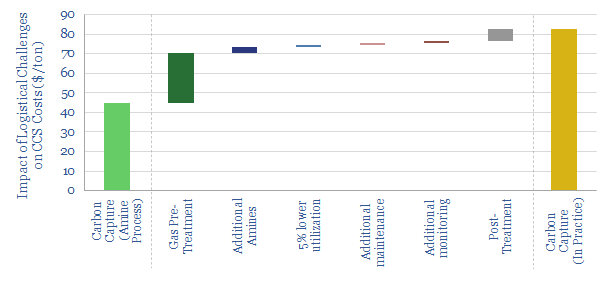
Post-combustion CCS has more practical challenges than we had previously assumed, as are explored in this 13-page report. Today’s established amines require extensive pre- and post-treatment of gases; to prevent degradation, plant corrosion and toxic emissions. This might double real-world CCS costs. But it also creates more opportunity for novel CCS processes, which are rapidly emerging.


CCS denotes any energy technology that prevents CO2 from combustion (or calcining) being released into the atmosphere. Our latest roadmap to net zero assumes 6 GTpa of CCS by 2050, of which one half, or 3 GTpa is conventional CCS. Data are given for the costs and energy penalties of conventional CCS — spanning across amine plants, CO2 pipelines, CO2 trucks, CO2 shipping and CO2 disposal — on page 2.

What now? Conventional CCS is likely to accelerate, due to reforms to the 45Q, in the US Inflation Reduction Act of 2022. Forecasts for the market’s evolution (in MTpa) are summarized on page 3.

As a result, practical and logistical issues are moving into view. Chief among them is whether conventional CCS actually works well in practice? How does it work? And are there hidden CCS challenges, which have not been tackled by 40MTpa of historical CCS projects? (pages 4-5).

Amine degradation lies at the root of these CCS challenges. Make-up rates for amines can be quantified from technical papers (data here). But these studies also show wide variability, and offer up useful data that will matter for real world installations.

CCS challenges. Seven challenges for commercial scale deployment of conventional CCS are presented on pages 7-10. We think lab studies under-estimate degradation rates, amine make-up processes will dent utilization, other operational parameters degrade alongside the amines, degraded amines corrode amine plants and equipment, they can result in toxic air emissions (nitrosamines are a possible show-stopper), especially where CCS plants are run intermittently, and all of the issues above can be highly sensitive to the impurities in the feed gases (SOx, NOx, particulates, etc, data here).

It is important to quantify and to understand these various CCS challenges, in order to risk CCS deployments appropriately. Or, conversely, to de-risk them.

Next-generation amines are being developed to overcome these challenges. The most mature example to cross our screen is profiled on page 11 (listed company), and seven further examples are profiled on page 12 (mainly private/venture companies).

Other abatement options. We had previously hoped that simple CCS would accelerate rapidly from 2023 onwards. However, there is a risk that today’s technically ready amine plants face more CCS challenges than anticipated, while many next-gen amines that overcome these challenges are not fully technically ready. This also makes us wonder whether there is more upside for other abatement options in the world’s roadmap to net zero (page 13).

Growing economies: reforest and reinvest?

clean economic development

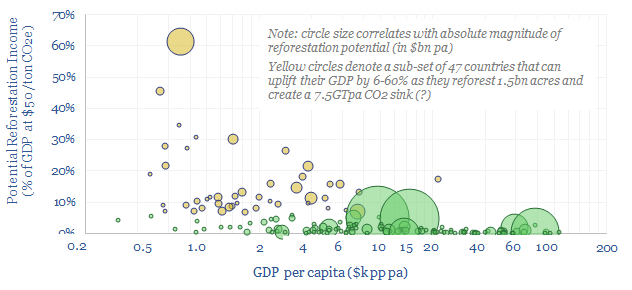
CO2 removal credits could add 6-60% to the GDP of 47 emerging countries as they reforest 1.5bn acres and create a 7.5GTpa CO2 sink, while the resultant cash flows could double these countries’ investment rates. Reinvesting in wind, solar, electrification avoids higher carbon fuels and deforestation for firewood. Reinvesting in timber value chains maximizes CO2 permanence and value. This 13-page note explores ‘reforest and reinvest’ as a promising framework for clean economic development in the energy transition.


An important objective in the energy transition is to accommodate clean economic development for 4bn people on Planet Earth, with incomes around $2k pp pa, who currently use 90% less energy per capita than the ‘top 1bn’ in the developed world (page 2).

However clean economic development requires investment, especially for clean infrastructure. Without financing this infrastructure, there are risks that development will be slower and more skewed to particularly high-carbon energy sources; such as cheap coal and even worse, firewood from deforestation (page 3).

But what if emerging countries could reforest half of the areas that have historically been deforested, selling the resultant CO2 credits at $50/ton, and reinvesting a large portion of the income? (page 4).

We think there are 47 countries where this model could uplift GDP by 6-60% and ‘double’ potential annual investment rates in the country. Examples, numbers and case studies are presented on pages 5-7.

Where to reinvest the cash flows from selling nature-based CO2 removals? We think that 2-10x multipliers can be achieved. In other words, if the sales proceeds from 1 ton of CO2 removals are reinvested in emerging world countries, they can abate 2-10 tons of future CO2, while promoting clean economic development, and progressively increasing the ‘quality’ of nature based CO2 removals (pages 8-9).

Integration into timber value chains is explored as a method to maximize value and ensure that sustainably harvested timber sees its carbon locked up for the long-term in higher-value construction materials, which are 20-60x more valuable than raw stumpage (pages 10-11).

Wind, solar and electrification can also be financed to lower countries’ reliance upon coal and deforestation wood. This option has a strong multiplier effect (numbers in the note) and also enhances the quality of reforestation in the country (page 12).

Implications for the energy transition? Emerging world reforestation may increasingly gather momentum as a clean economic development model. We think this presents opportunities for companies that align themselves with the ‘reforest and reinvest’ model, while it will contribute to pushing high cost options off of the CO2 abatement cost curve.

Copyright: Thunder Said Energy, 2019-2024.