Search results for: “pneumatic”
-
Methane emissions from pneumatic devices: by operator, by basin?
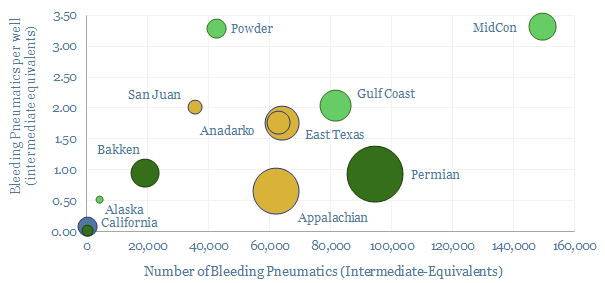
Methane leaks from 1M pneumatic devices across the US onshore oil and gas industry comprise 50% of all US upstream methane leaks and 20% of upstream CO2. This file aggregates the data. Rankings reveal operators with a pressing priority to replace >100,000 medium and high bleed devices, and other best-in-class companies.
-
US CO2 and Methane Intensity by Basin
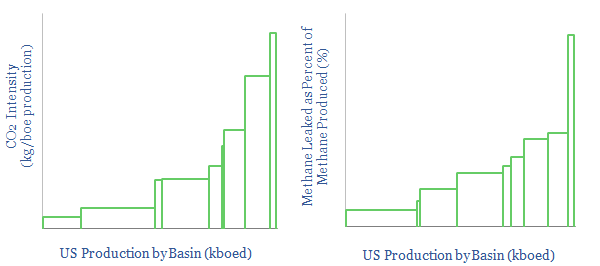
The CO2 intensity of oil and gas production is tabulated for 425 distinct company positions across 12 distinct US onshore basins in this data-file. Using the data, we can aggregate the total upstream CO2 intensity in (kg/boe), methane leakage rates (%) and flaring intensity (in mcf/boe), by company, by basin and across the US Lower 48.
-
Fugitive methane: what components are leaking?
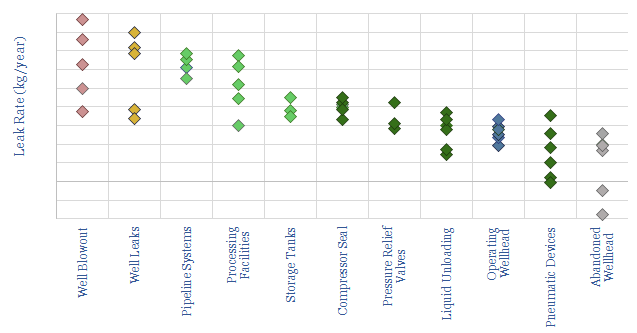
This data-file looks through 35 technical papers to tabulate methane leaks from different components around the oil and gas industry. The largest are losses of well control (up to 1MTpa), then mid-downstream facilities (up to 10kTpa), compressors (up to 100T), pneumatic devices, wellheads and liquid unloading (up to 10T).
-
CH4 context: the largest methane leaks of all time?
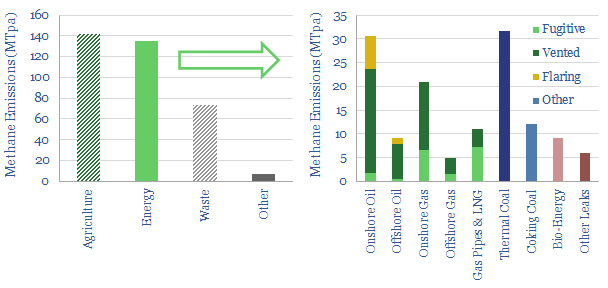
Global methane emissions run to 360MTpa. 40% is agriculture, 40% is the energy industry and 20% is landfills. Within energy, over 30% of the leaks are from coal, 30% are from oil, 27% are from gas. This short note quantifies some of the largest methane leaks of all time, and provides context for the recent…
Content by Category
- Batteries (89)
- Biofuels (44)
- Carbon Intensity (49)
- CCS (63)
- CO2 Removals (9)
- Coal (38)
- Company Diligence (95)
- Data Models (840)
- Decarbonization (160)
- Demand (110)
- Digital (60)
- Downstream (44)
- Economic Model (205)
- Energy Efficiency (75)
- Hydrogen (63)
- Industry Data (279)
- LNG (48)
- Materials (82)
- Metals (80)
- Midstream (43)
- Natural Gas (149)
- Nature (76)
- Nuclear (23)
- Oil (164)
- Patents (38)
- Plastics (44)
- Power Grids (130)
- Renewables (149)
- Screen (117)
- Semiconductors (32)
- Shale (51)
- Solar (68)
- Supply-Demand (45)
- Vehicles (90)
- Wind (44)
- Written Research (354)