Can additive manufacturing overcome bottlenecks in gas turbine components, aerospace-related capital goods, and custom products that are unlocked by AI? This 16-page report re-evaluates the outlook for 3D printing, its economics, energy use, and company implications.
Recent case studies using additive manufacturing include Siemens Energy manufacturing burner fronts of gas turbines, from nickel super-alloys, rated to 1,250ºC and 13,000 rpm. This made us wonder: can additive manufacturing overcome bottlenecks amidst the rise of AI? Other recent use cases are on pages 2-3.
Across many supply chains, labor is 20-50% of total production costs. 5M industrial robots have now been deployed, saving 1 FTE role per $100k of capex, or replacing it with c10MWH pa of electricity, unlocking 1.5-year payback periods and 65% IRRs. So could additive manufacturing also help in debottlenecking and reshoring supply chains?
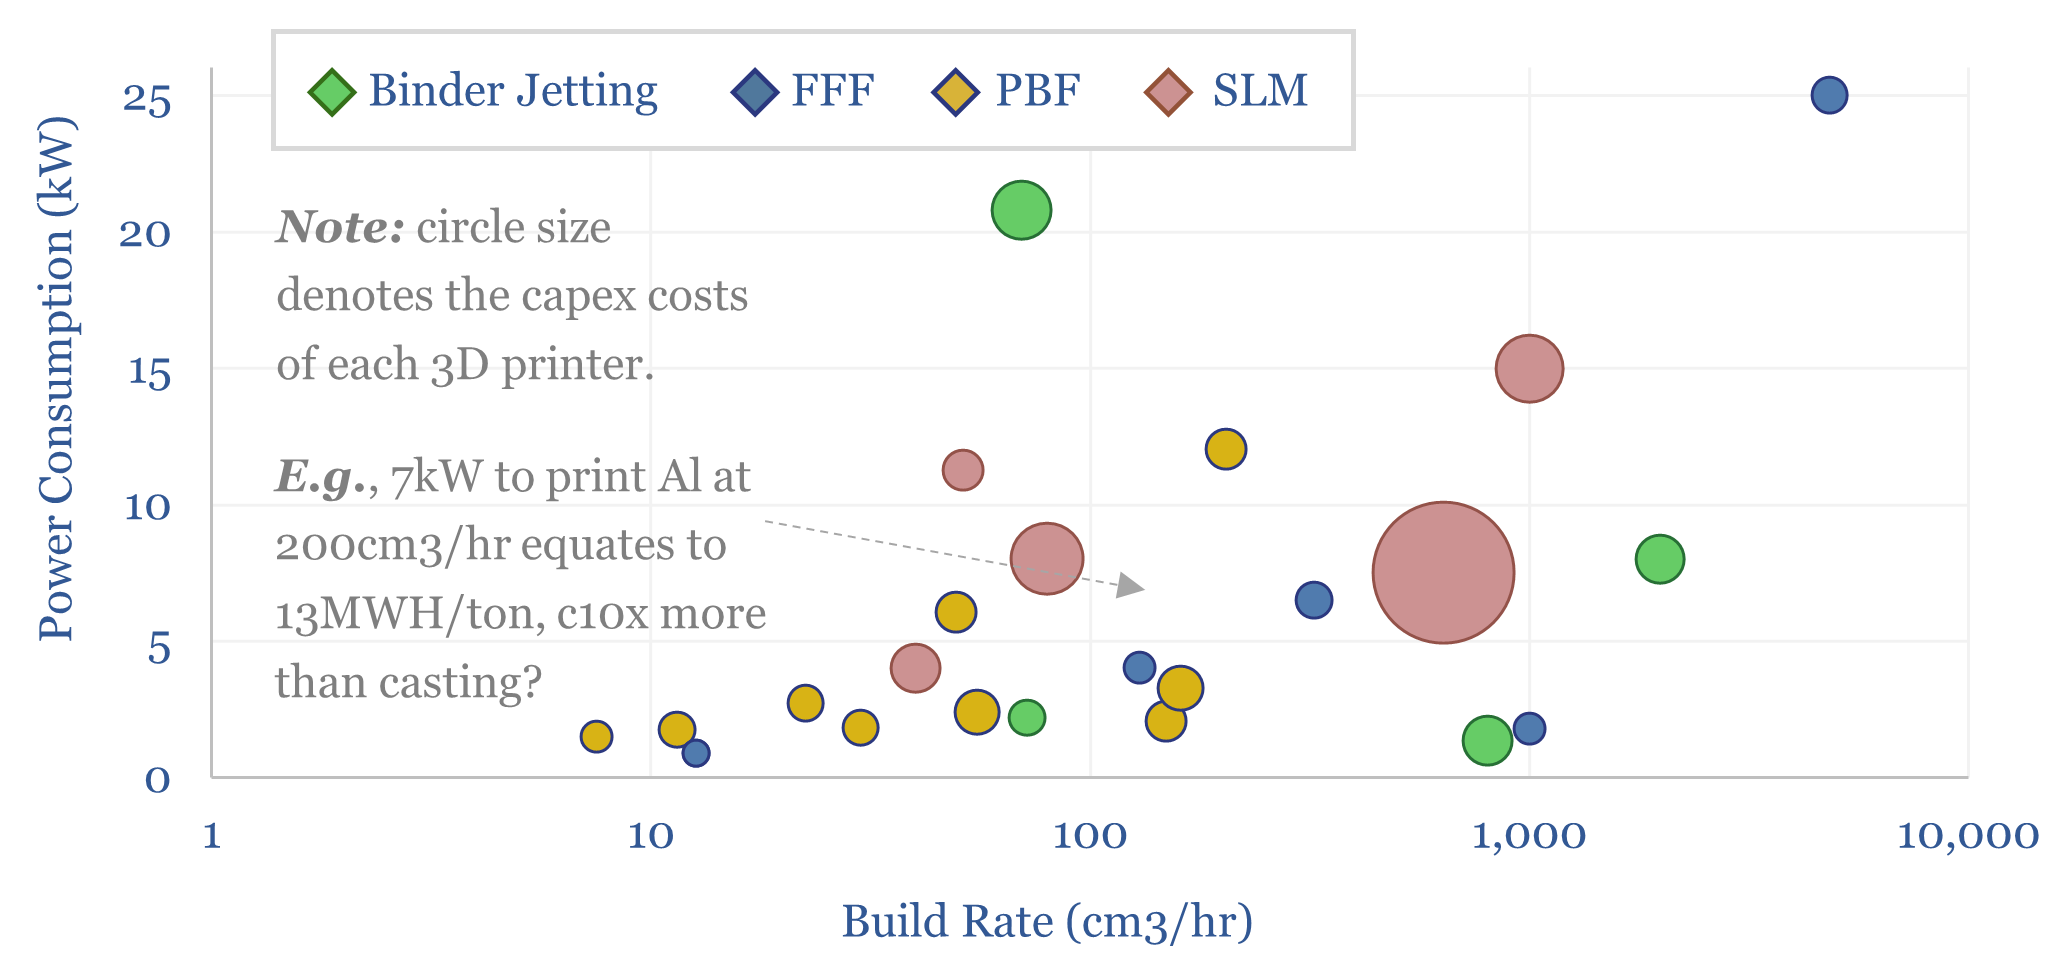
What is additive manufacturing? An overview of FFF, binder jetting, PBF and SLM are given on page 4. We have compiled data into additive manufacturing machines, their capex costs, build-rates, power consumption and energy consumption per m3 of material on pages 5-6.
The economic costs of additive manufacturing versus investment casting depend on the context, and most of all, the number of products that need to be produced. The costs of additive manufacturing, costs of investment casting and the costs of polymer extrusion are compared and contrasted on pages 7-9.
Energy implications are that additive manufacturing could help to debottleneck the ramp-up of gas turbine deliveries, despite using around 10x more energy per manufactured part than investment casting. A more customized world, enabled by AI, would also use more 3D printing, as discussed on pages 10-12.
Additive manufacturing is, however, highly fragmented. The global market today is $15bn pa, but the top twenty companies in additive manufacturing only generate $4bn in AM revenue, or 25% of the market. Conversely, in the average value chain, the top five companies alone have 50% share. Leading companies, and more interestingly, material suppliers, are profiled on pages 13-16.