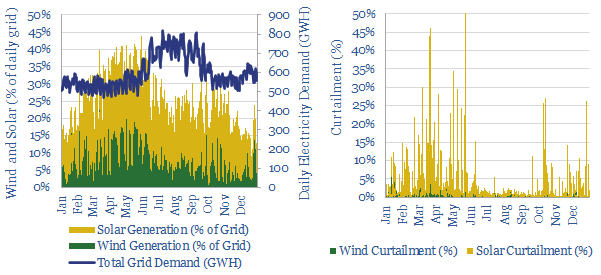
This data-file tracks curtailment of wind and solar assets in California, in order to assess the opportunity of integrating more renewables. c25% of California’s total grid demand in 2021 was met by wind and solar energy generated in the State.
On average, 0.4% of the wind and 4% of the gross solar generation were curtailed throughout the year. But the data are highly variable.
Curtailment was highest in March, when 1% of the wind and 12% of the gross solar generation were curtailed. There were even five days in the year where over 30% of the solar was curtailed. On the other hand, August was the ‘best’ month, where only 0.3% of the wind and 0.9% of the solar generation was curtailed.
The uneven distribution is somewhat unhelpful for the economics of grid-scale batteries. We estimate that 10% of the curtailment could be avoided by the ‘best’ battery installations, which get to charge-discharge 360 days per year. Another 7% could be avoided by the next best battery installations, which get to charge-discharge c300 days per year. And so on.
However, the final 50% of the curtailment would require resorting to low utilization batteries, which only get to charge-discharge on fewer than 70 days per year, raising their costs, lowering their EROEI.