The purpose of this data-file is to assess how ‘industrial activity’ has changed, in China and in the West (US and Europe), from 1999-2019, as a proxy for the phenomenon called ‘carbon leakage’.
To do this, we have quantified volumes of specific materials (steel, aluminium, copper, plastics, glass, industrial acids) and manufactured goods (cars, refrigerators, textiles, washing machines).
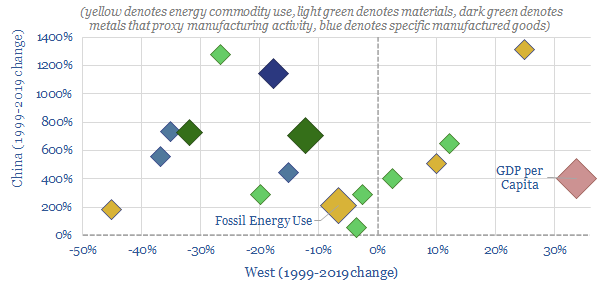
Our broad conclusion is that heavier industrial activity is down 12% in the West over this 20-year period, and up 6.5x in China. At the same time, GDP is up c50% in the West and up 5.5x in China.
The greatest leakage has likely occurred for cars, electronics and machinery. Although other sectors such as solar panels or lithium batteries, where China dominates the supply chain cannot be measured in this data-file, as there is no 1999 baseline.
The data-file also quantifies the share of different energy transition products – wind, solar, batteries, related metals – that are made in China.