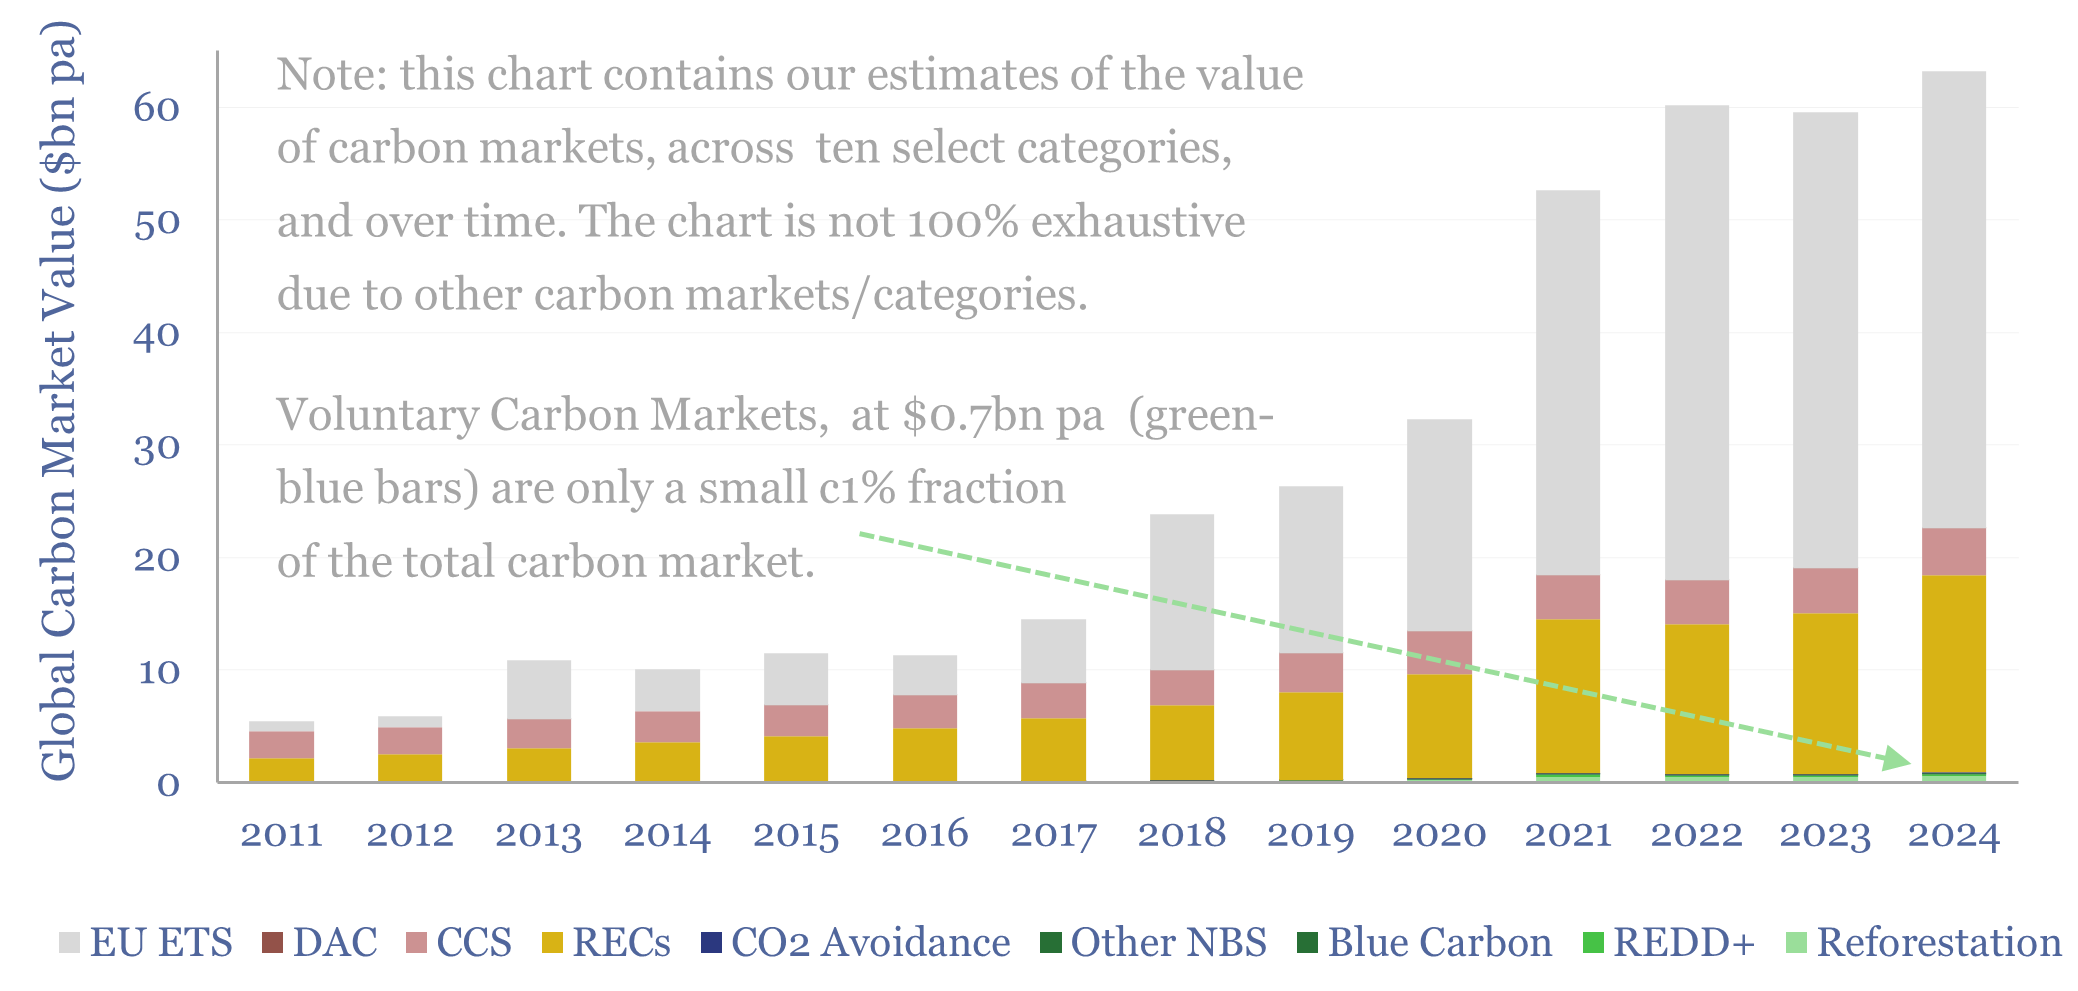
This data-file quantifies the size of global carbon markets by category over time, including the EU ETS as an example of a compliance market, RECs, CCS and VERRA-certified “carbon credits”, across categories such as REDD, reforestation and other “carbon offsets”. We also draw analogies with charitable giving and forecast carbon markets out to 2050.
Be careful with studies purporting to quantify “global carbon markets”. One study from 2023 stated that the market had reached almost $1trn, covering 12.5GT of CO2, which makes it sound like carbon markets are truly enormous, on the level of global steel ($1.5trn pa), oil ($3trn pa) or the global auto market ($2.7trn pa).
The issue with these massive-sounding estimates of carbon markets is that they mainly reflect trading churn and hardly represents true CO2 abatement at all. The same underlying credit might be traded 8x over via futures contracts.
Our chart above captures the value of ten different categories of carbon markets. Markets like the EU ETS are quantified according to the cost incurred when industrial emitters purchase EUAs at auction. Also included Renewable Energy Certificates, where buyers pay renewables developers for the legal right to claim that the electricity they used in a given year is the electricity that has been generated from the wind, solar, nuclear or hydro facility.
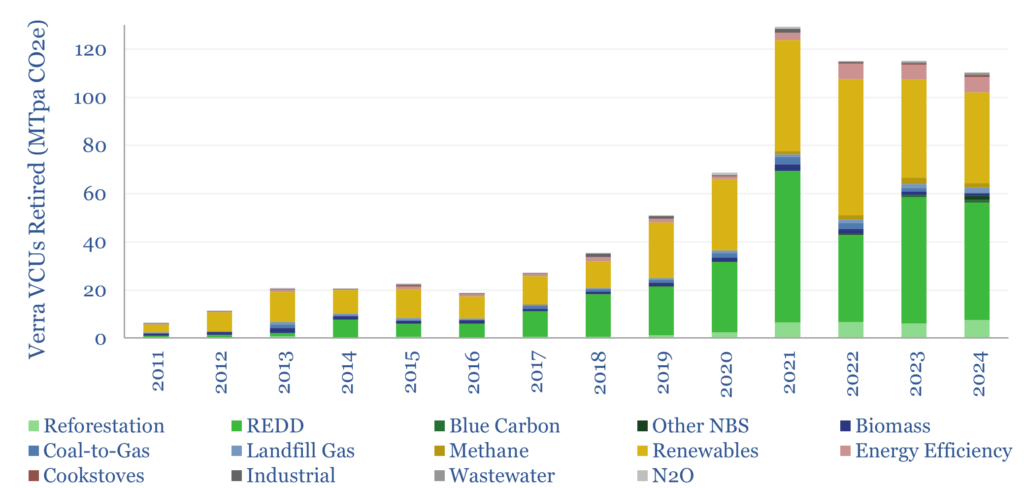
VERRA is the largest certification agency in the $720M pa voluntary carbon market, issuing 60-70% of these credits. 110MT of its carbon credits were retired last year, as compiled here. Getting to the chart below required downloading over 250,000 lines of data, across 130 different categories. We then grouped the data.

50MT of REDD credits (“Reduced Emissions from Deforestation and forest Degradation”) were retired in 2024, 45% of the total, worth c$200M. Although buyers are increasingly wary of whether these credits are real and/or are like “offsetting your flight by not taking a return flight”.
Reforestation credit retirements, which actually pull CO2 out of the air then certifiably store it in nature, reached a new high of 7.5MTpa in 2024, rising at a 45% CAGR (only methane mitigation credits rose faster, among the major categories, at +50% pa). These credits are sought after by large-scale buyers, and pricing can reach $50-100/ton, depending on quality.
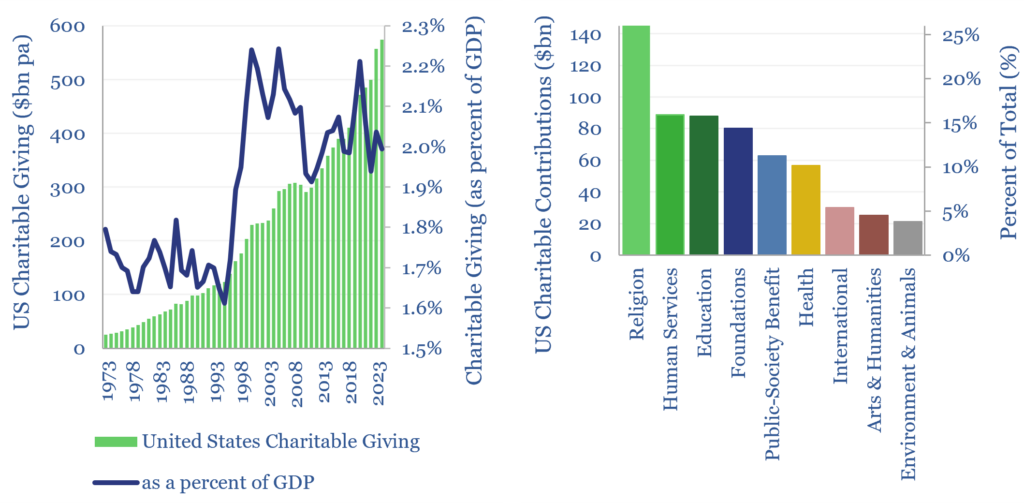
Charitable giving may foreshadow the future size of carbon markets. For example, the US now makes c$600bn of donations to charity each year, running at c2% of US GDP over the past half-century. Hence even if our roadmap to net zero does not seem to be what is actually happening, carbon markets could still become very large, if climate-conscious individuals and companies donate 0.15-0.2% of global GDP to environmental causes by 2050.

Forecasts for the size of future carbon markets are given in the data-file – across RECs, CCS, reforestation and other offsets, and per our recent note. We will continue tracking the evolution and size of carbon markets in this data-file.
