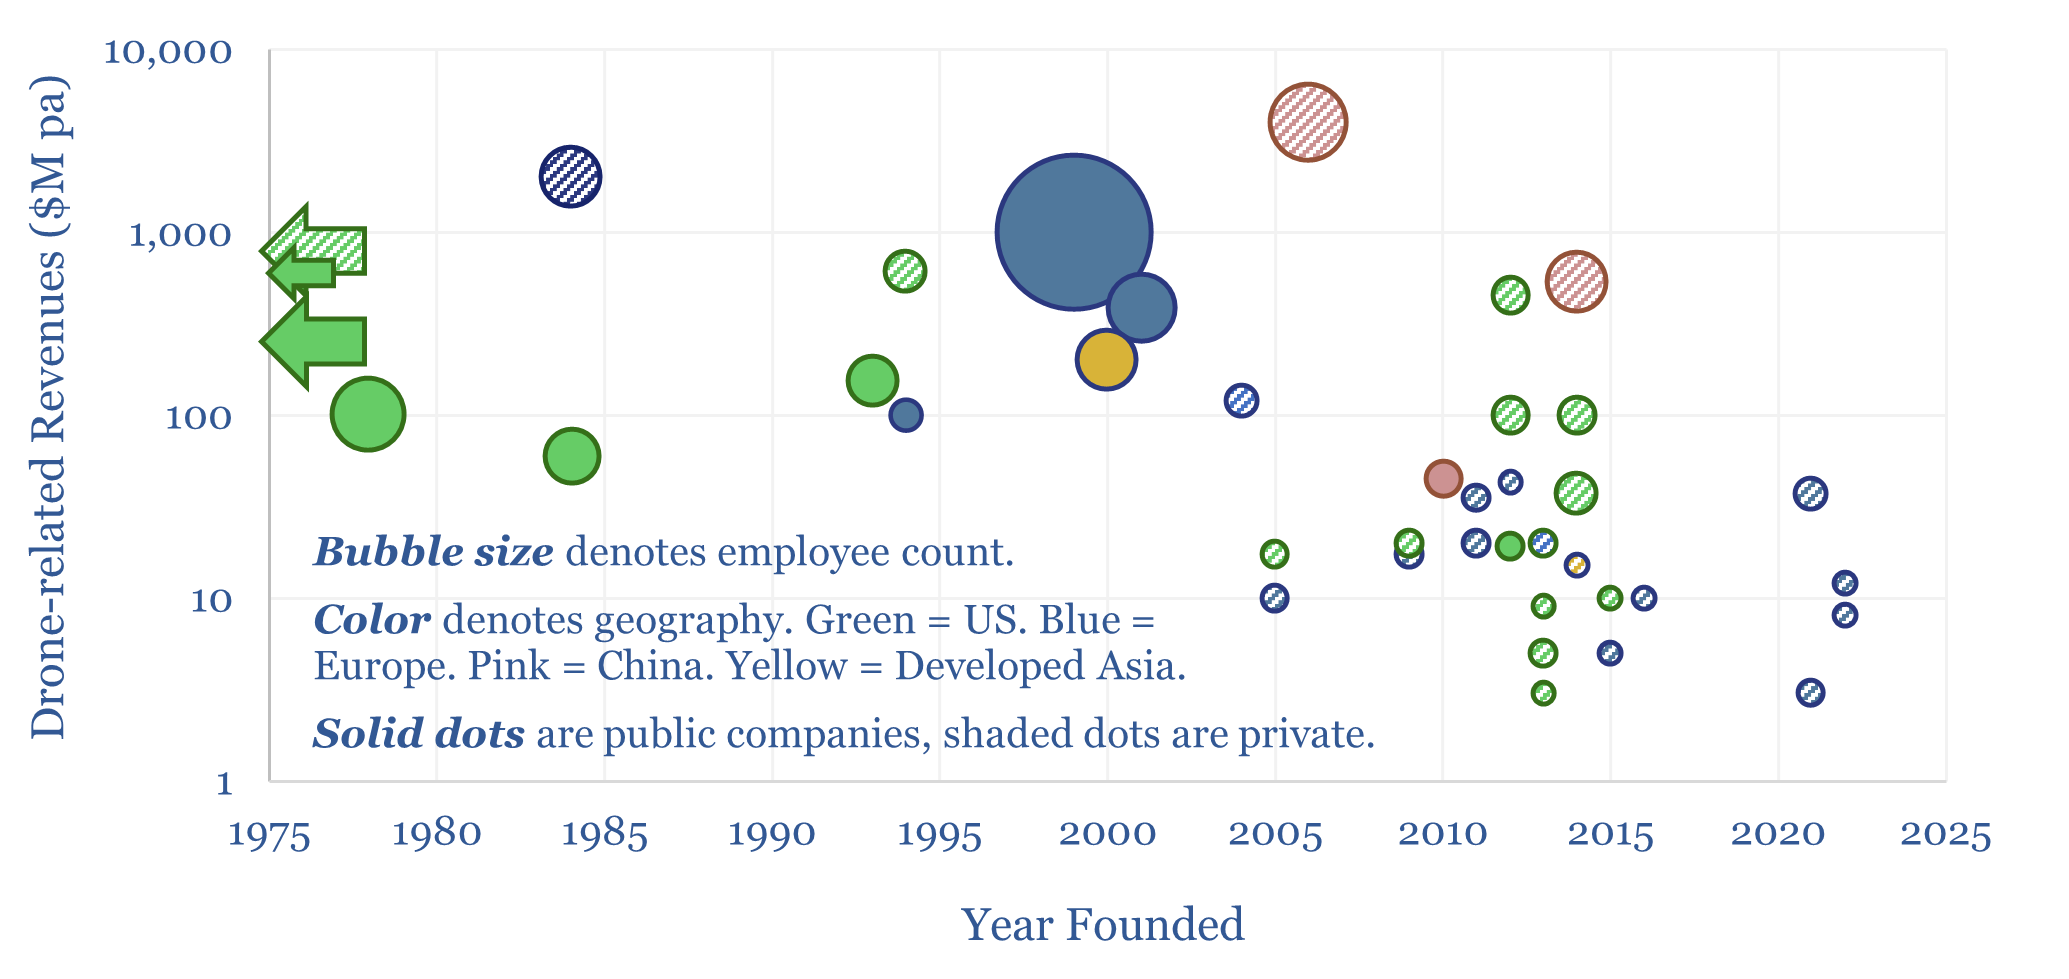
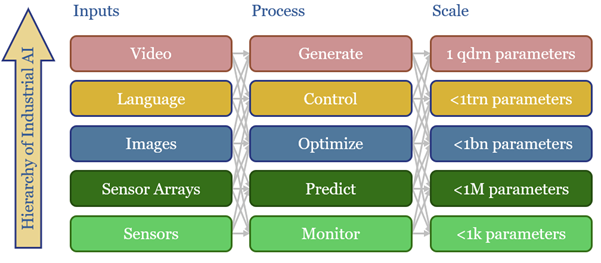
Absorption chillers perform the thermodynamic alchemy of converting waste heat into coolness. Interestingly, their use with solid oxide fuel cells may have some of the lowest costs and CO2 for powering and cooling AI data-centers. This 14-page report explores the opportunity, costs and challenges.
Kraken Technologies: smart grid breakthrough?
Kraken Technologies is an operating system, harnessing big data across the power value chain, from asset optimization, to grid balancing, to utility customer services. We reviewed ten patents, which all harness big data, of which 65% optimize aspects of the grid, and 40% are using AI. This all supports electrification, renewables and EVs.
Octopus Energy is a private UK utility, founded in 2015, with 3,000 employees, serving 8M customers, offering the UK’s largest “smart-tariff” where prices are adjusted according to time-of-use.
Kraken Technologies is an operating system, developed by Octopus, harnessing big data from increasingly digital power networks and smart meters, in order to enable utility solutions, from asset optimization to improved customer services (details in the data-file).
This Kraken technology review explored ten patent families in Espacenet, and how they are being used to enable Virtual Power Plants, Grid Balancing, Frequency Support, Reactive Power Compensation, Fault Localization, Grid Monitoring, Customer Support and Energy Savings. It is a long and impressive list, which shows the potential of smart grids.
For example, electric vehicles, heat pumps and residential solar arrays collectively represent large loads, but are all individually too small to participate in balancing markets. One of the Kraken patents receives data from smart meters, filters noise, prioritizes data that matter, calculates flexible load within 5 seconds, then relays back balancing instructions to individual devices.
Effectively all of the patents that we reviewed focused on what can be achieved by aggregating more big data within power grids, 65% looked at optimizing various aspects across the utility value chain using the data, and 40% are using AI.
Our observations on the patent library are also discussed in the data-file, while we have summarized six of the patents in particular detail. We have argued that greater digitization of historically dumb power networks will unlock an additional c10% integration of wind and solar, beyond the natural limits suggested by their volatility.
Groq: AI inference breakthrough?
Groq has developed LPUs for AI inference, which are up to 10x faster and 80-90% more energy efficient than todayโs GPUs. This 8-page Groq technology review assesses its patent moat, LPU costs, implications for our AI energy models, and whether Groq could ever dethrone NVIDIAโs GPUs?
Groq is a private company, founded in 2018, with 250 employees, based in Mountain View, California, founded by ex-Google engineers. The company raised a $200M Series C in 2021 and a $640M Series D in August-2024, which valued it at $2.8bn.
The Groq LPU is already in use, by “leading chat agents, robotics, FinTech, and national labs for research and enterprise applications”. You can try out Meta’s Llama3-8b running on Groq LPUs here.
Groq is developing AI inference engines, called Language Processing Units (LPUs), which are importantly different from the GPUs. The key differences are outlined in this report, on pages 2-3.
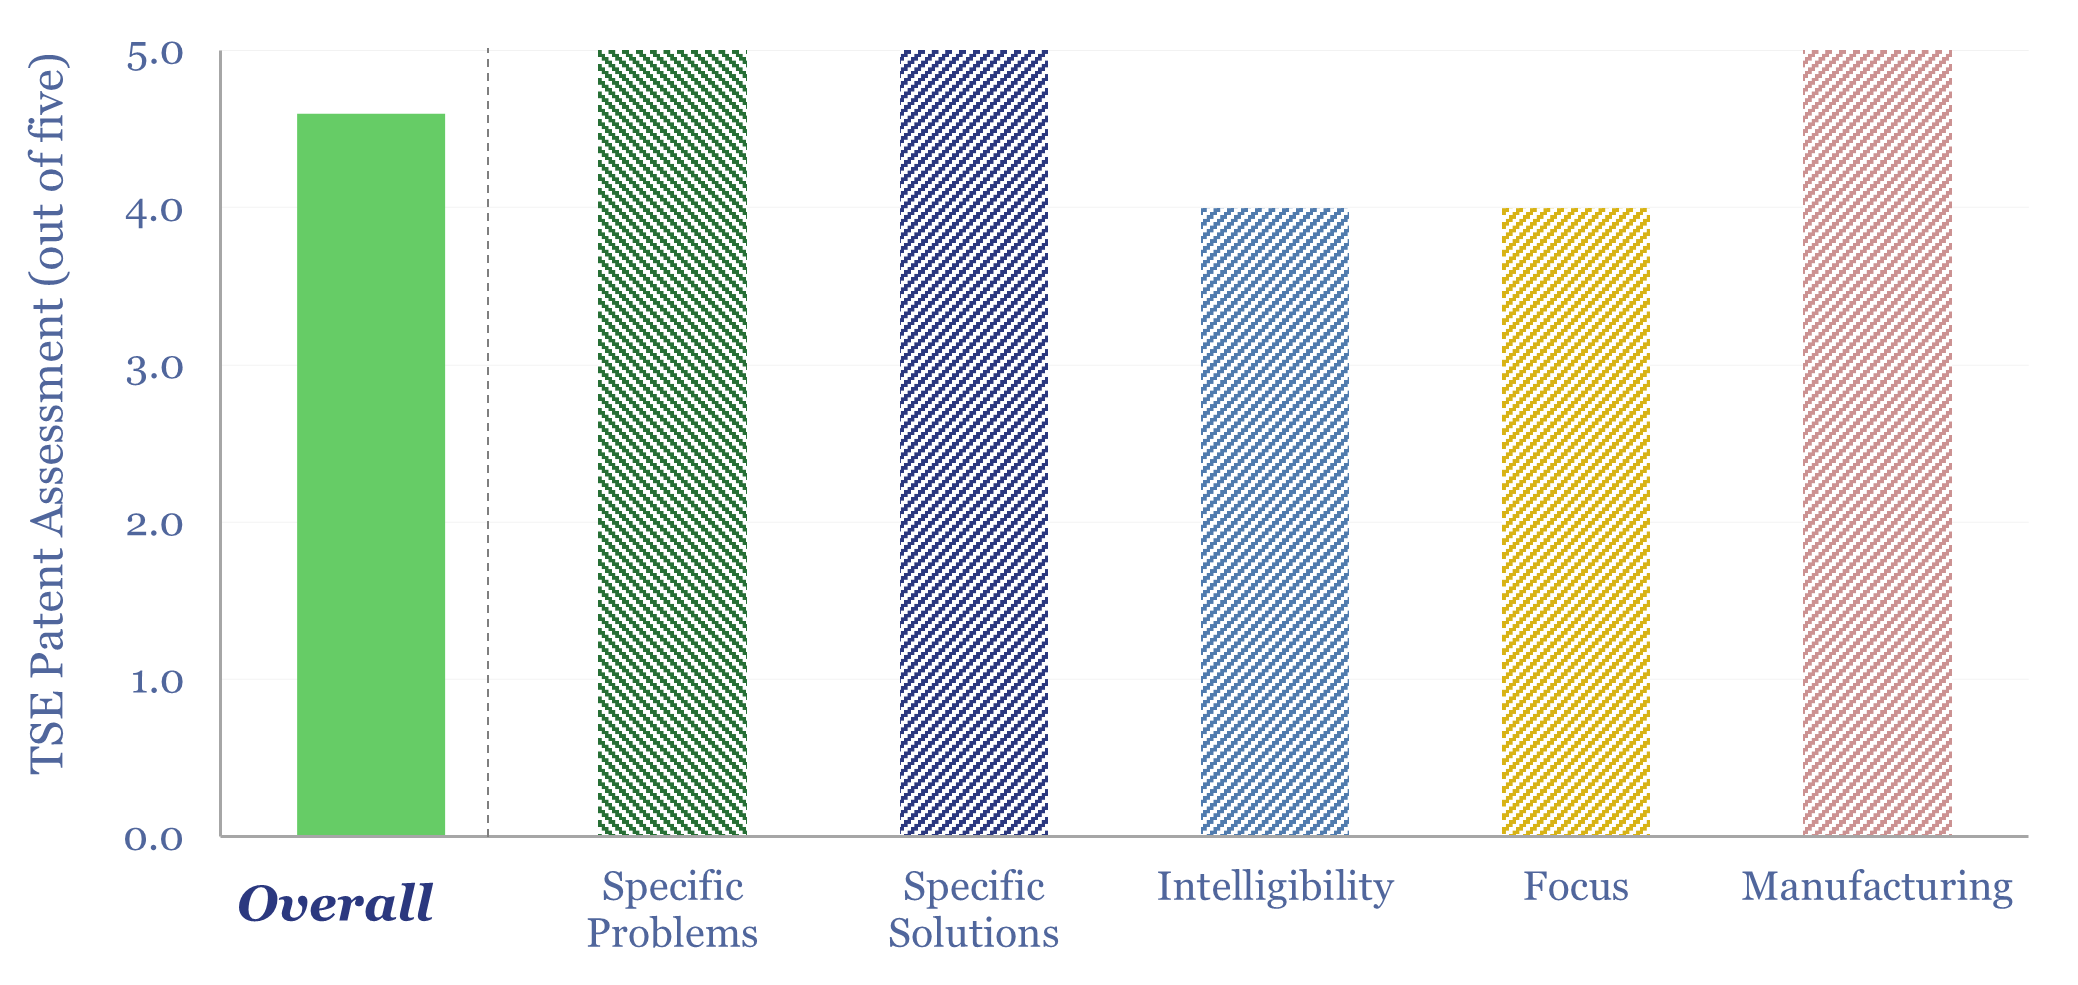
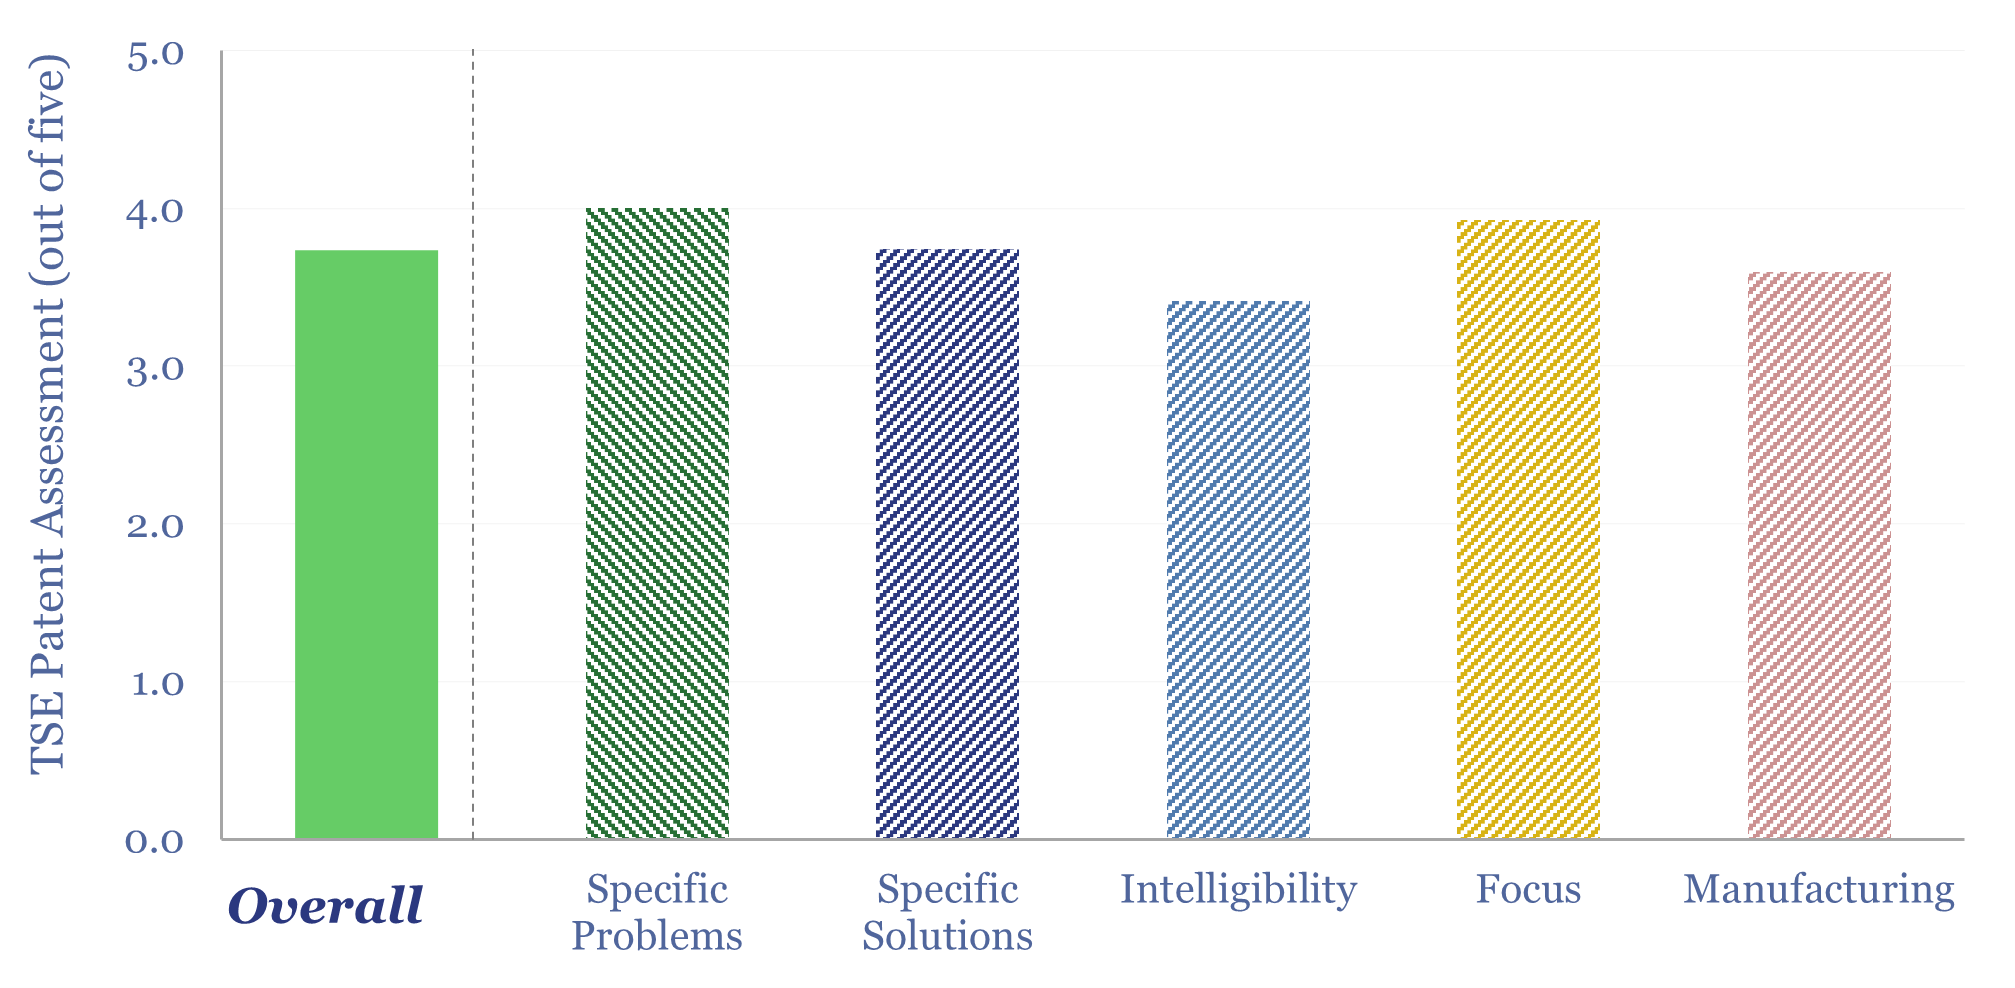
Across our research, we have generally used a five-point framework, in order to determine which technologies we can start de-risking in our energy transition models. For Groq, we found 46 patent families, and reviewed ten (chart below). Our findings are on pages 4-5.
Our latest published models for the energy consumption of AI assumed an additional 1,000 TWH of electricity use by 2030, within a possible range of 300 – 3,000 TWH based on taking the energy consumption of computing back to first principles. Groq’s impact on these numbers is discussed on pages 6-7.
NVIDIA is currently the world leader in GPUs underlying the AI revolution, which in turn underpins its enormous $3.6 trn of market cap at the time of writing. Hence could Groq displace or even dethrone NVIDIA, by analogy to other technologies we have seen (e.g., the shift from NMC to LFP in batteries). Our observations are on page 8.
For our outlook on AI in the energy transition, please see the video below, which summarizes some of the findings across our research in 2024.
Moving targets: molecules, electrons or bits ?!
New AI data-centers are facing bottlenecked power grids. Hence this 15-page note compares the costs of constructing new power lines, gas pipelines or fiber optic links for GW-scale computing. The latter is best. Latency is a non-issue. Thus AI reshapes the future of US shale, midstream and fiber optics?
Fiber optic data transmission costs?
The costs of fiber optic data transmission run at $0.25/TB per 1,000km in order to earn a 10% IRR on constructing a link with $120 per meter capex costs. Capex is 85% of the total cost. This data fiber breaks down the costs of data transmission from first principles, across capex, utilization, electricity and maintenance.
This model captures the costs of transmitting data across fiber optic cables, with a base case of $0.25/TB to earn a 10% IRR per 1,000km of data transmission. For an overview, please see our data-file into the energy use of fiber optic cables.
The economics of fiber optic cables are sensitive to cable length, utilization, and especially capex costs, which comprise 85% of the total costs, and are estimated in the data-file by tabulating details on 25 past fiber optics projects and their fiber counts (chart below).
The fiber running to an individual household might have 1-2 fiber optic strands, while a data-center interconnection (DCI) between two hyperscale facilities can have several thousand fibers.
Generally, each 10x increase in the number of fiber optic strands per cable only doubles the cost. A key reason is that 60-80% of total costs are construction, which do not change materially for higher-capacity cables.
Other factors that impact the capex costs of fiber optic cables: underground cables cost around 2-3x aerial cables. Undergrounding costs are also higher in rockier soil types and in urban environments. There are some nice cost breakdowns in the Capex_costs tab of the model, and in the backup tabs, compiling cost in $/m for fiber vs copper.
Capex costs per Tbps of bandwidth can also be estimated, with a formula linking capex costs ($/m) to the bit rate (Trillion bits of data transfer capacity per second, Tbps). Some intercontinental fiber links quote a specific bandwidth in Tbps, helped by amazing multiplexing. For others, we can estimate the bandwidth from the fiber count.
Utilization rate is another variable that impacts the costs of fiber data transmission, which can be stress-tested in the model. Hurdle rate also matters. The energy consumption of fiber optic cables matters less, but is also included in the model.
Internet energy consumption: data, models, forecasts?
This data-file forecasts the energy consumption of the internet, rising from 800 TWH in 2022 to 2,000 TWH in 2030 and 3,750 TWH by 2050. The main driver is the energy consumption of AI, plus blockchains, rising traffic, and offset by rising efficiency. Input assumptions to the model can be flexed. Underlying data are from technical papers.
Our best estimate is that the internet accounted for 800 TWH of global electricity in 2022, which is 2.5% of all global electricity. Despite this area being a kind of analytical minefield, we have attempted to construct a simple model for the future energy demands of the internet, which decision-makers can flex, based on data and assumptions (chart below).
Internet traffic has been rising at a CAGR of 30%, as shown by the data use of developed world households, rising to almost 3 TB per user per year by 2023. The scatter also shows a common theme in this data-file, which is that different estimates from different sources can vary widely.
Future internet traffic is likely to continue rising. By 2022 there were 5bn global internet users underpinning 4.7 Zettabytes (ZB) of internet traffic. Users will grow. Traffic per user will likely grow. We have pencilled in some estimates, but uncertainty is high.
The energy intensity of internet traffic spans across data-centers, transmission networks and local networking equipment. Again, different estimates from different technical papers can vary by an order of magnitude. But a first general rule is that the numbers have declined sharply, sometimes halving every 2-3 years.
The current energy intensity of the internet is thus estimated at 140 Wh/GB in our base case, broken down in the waterfall chart below, using our findings from technical papers and the spec sheets of underlying products (e.g., offered by companies such as Dell).
Energy intensity of internet processes will almost certainly decline in the future, as traffic volumes rise. Again, we have pencilled in some estimates to our models, which can be flexed.
However the energy needed for AI is now rising exponentially. Training Chat GPT-3 in 2020 used 1.3 GWH to absorb 175bn parameters. But training chat GPT-4 in 2023ย used 50 GWH to absorb 1.8trn parameters.ย We find a 98% correlation between AI training energy and the total compute during training.
AI querying energy is also correlated with the complexity of the AI model, and thus will likely continue rising in the future. Average energy use is estimated at 3.6 Wh per query today, which is 4x more than an email (1 Wh) and 10x more than a google search (0.3 Wh).
Muting the impacts of larger data-processing volumes, we expect a 40x increase in future computer performance in GFLOPS per Watt (chart below). This yields 900 TWH of AI demand around 2030, revised up from 500 TWH in April-2023 (chart above).
Please download the model to stress-test your own estimates for the energy intensity of the internet. It is not impossible for total electricity demand to ‘go sideways’ (i.e., it does not increase). It is also possible for the electricity demand of the internet to exceed our estimates by a factor of 2-3x if the pace of productivity improvements slows down.
Omniscience: how will AI reshape the energy transition?
AI will be a game-changer for global energy efficiency. It will likely save 10x more energy than it consumes directly, closing ‘thermodynamic gaps’ where 80-90% of all primary energy is wasted today. Leading corporations will harness AI to lower their costs and accelerate decarbonization. This 19-page note explores the opportunities.
What is the energy consumption of the internet?
Powering the internet consumed 800 TWH of electricity in 2022, as 5bn users generated 4.7 Zettabytes of traffic. Our guess is that the internetโs energy demands double by 2030, including due to AI (e.g., ChatGPT), adding 1% upside to global energy demand and 2.5% to global electricity demand. This 14-page note aims to break down the numbers and their implications.
Energy intensity of fiber optic cables?
What is the energy intensity of fiber optic cables? Our best estimate is that moving each GB of internet traffic through the fixed network requires 40Wh/GB of energy, across 20 hops, spanning 800km and requires an average of 0.05 Wh/GB/km. Generally, long-distance transmission is 1-2 orders of magnitude more energy efficient than short-distance.
An optical fiber consists of a glass core, through which light signals can travel ultra-rapidly via total internal reflection, surrounded by at least one sheathing layer.
A fiber optic cable consists of at least one optical fiber, often many, surrounded by protective exterior layers of sheathing and possibly armoring. By 2020, over 5bn kilometers of fiber-optic cables have been deployed globally. Estimates vary, but the fiber optic cable market is likely worth $10bn per year.
A transceiver (aka a transducer) is an electric device that converts electrical signals into light signals (e.g., a laser-based transmitter) or vice versa (e.g., a photo-diode based receiver). The optical transceiver market is worth around $10bn per year.
The fiber optic network is a constellation of transceivers and fiber optic cables, which are capable of transmitting data between data-centres and internet users. A commonly used acronym is PON which stands for the Passive Optical Network, and simply transmits data.
Bitrate is the capacity of a digital network to transmit information. It is measured in Gbps. Gbps stands for Gigabits per second. 1 Gbps means that 1 billion bits of information can be passed along the fiber optic cable each second (there are 8 bits in a byte).
The frequency of a fiber optic system is measured in MHz. 1 MHz means that the cable can carry 1 million distinct ‘packets’ of information per second (i.e., 1 Mbps). Typical frequencies are 10-100MHz, but can reach into the GHz range.
Many distinct signals can be carried through a fiber optic cable at the same time by “multiplexing” them. This might include carrying them at different frequencies or wavelengths. For example, ‘dense wavelength division multiplexing’ (DWDM) can carry 80-100 different frequencies through the same optical fiber (different colors). The signals can later be de-multiplexed.
Prysmian notes a typical fiber optic cable will enable 1-10 Gbps download speeds, which is 30-50x faster than a comparable copper cable (25-300 Mbps), and an order of magnitude above satellites or DSL (0.5 – 75 Mbps). The world record for data transmission through a fiber optic cable at the time of writing is 1.84 petabits per second (achieved in 2022 by researchers from the University of Denmark, on a single, 7.9km fiber optic cable, split into 37 lines with 223 frequencies per line). This is something equivalent to transmitting 1bn Zoom calls simultaneously.
The strength of a signal in a fiber optic cable is measured in dBm, where 0 dBm is the equivalent of 1mW (1,000th of a Watt). Note that decibels are logarithmic around base 10. Hence 10dBm is equivalent to 10mW, 20dBm is equivalent to 100mW, 30dbm is equivalent to 1W; while -10dBm is 0.1mW, -20dBm is -0.01mW and -30dBm is -0.001mW.
Attenuation is the difference between the launch power of the signal from the transmitter and the power of the signal at the receiver. The rate of attenuation will depend on the precise dimensions and materials of the cable, but a good rule of thumb is in the range of 0.2dB per kilometer. Each connector likely also introduces a 0.75dB loss.
To combat the impacts of attenuation across a longer cable one must either: project a higher power level from the initial transmitter; deploy a more sensitive (and thus more expensive) receiver; or install a series of amplifiers/repeaters along the length of the cable, to boost it (e.g., every 20km). Although this adds to the energy intensity of fiber optic cables.
Another limitation on the length of a cable comes from dispersion. This is not related to the signal attenuating (i.e., getting weaker). It is due to the signal ‘spreading out’ and becoming noisy. To combat attenuation, filtering needs to be applied within the circuitry of the amplifier/repeater. As a general rule, thin “single mode” fibers, with c10ฮผm cores will have longer ranges than thicker “multi-mode” fibers with c50-100ฮผm cores, as the thinner core confines the light more and limits dispersion. So in a sense, a fiber optic cable is the opposite of a pipeline, where greater widths enable greater flow.
Using these definitions, we can compile data into the energy consumption of fixed fiber lines and their bit rates. Using these numbers, we can estimate the power consumption of data transmission infrastructure, which is ‘always on’, transmitting signals on one side of a fiber optic cable and listening for signals on the other side.
Power consumption of fiber optic cables can range from 0.01-100 W/Gbps depending on the length of the cable (chart below). As a mid-point, a 2-5km cable might have a power consumption of 1W/Gbps and consume around 0.1 Wh/GB of data transmission, which equates to 0.05 Wh/GB/km. Numbers can be flexed in the data-file.
Larger and more highly utilized cables will have 1-2 orders-of-magnitude lower energy consumption (chart below). Thus the energy intensity of fiber optic cables is not a fixed number, but highly context-sensitive.
Energy consumption will continue falling, per the historical trend (chart below, data here). The energy in the signal that is transmitted through a fiber optic cable (quoted in dBm), in physics terms, represents 0.05% of the total electricity use of the data transmission network. The energy consumption is not in the laser pulse. It is in encoding and decoding it, and the balance of electronic systems. Hence there is huge room to improve, including through improved cables, improved transceivers, more sensitive photo-diodes, greater frequencies, greater multiplexing.
Overall the energy consumption of a fiber optic cable is very low. It might take 0.05 Wh to move 1GB by 1km. For contrast, the numbers to move 1 ton or 1 person by 1km can be around 15,000x higher (data here).
Our outlook on the future energy consumption of the internet is written up in our recent research note here, and all of our broader energy demand data are here.
Corning is the leading manufacturer of fiber optic cables and had produced over 1bn kilometers of optical fiber by 2017 (and comes up in our glass fiber research). Prysmian produces 30M km of optical fiber each year across five plants worldwide (and comes up repeatedly in our research). Many sources cite Finisar, a division of Coherent and Molex as having the largest market share in transceivers. Broadcom is a $260bn (market cap) giant, producing connectivity equipment, and has a Top 3 market share in transceivers. Sumitomo is also active, making both cables and transceiver modules. Air Products notes that it supplies industrial gases, such as argon, helium and hydrogen used in production. High-quality silica glass and specialty plastics are also used in the cabling.
Sentient Energy: smart grid breakthrough?
This data-file is a technology review for Sentient Energy, assessing innovations in smart grids. Its technology can achieve energy savings via a combination of “Conservation Voltage Reduction” and “Volt-VAR optimization at the grid edge”. This also helps to integrate more solar and EV charging into power grids. We will explain the technology below and in the data-file.
Sentient Energy is as an “intelligent sensing platform for grid utilities”, helping power utilities to identify and remediate grid issues. It has “the largest mesh network line sensor deployments in North America”. It is a private company. It was founded in 2009, headquartered in Frisco, TX and employs around 150 people. Its products are used by over 25 of North America’s largest utilities, and have helped reduced outage time by 20%, patrol costs by 60% and clocked up 1bn+ intelligent sensor hours in the field.
Volt-VAR optimization at the grid edge is the focus in about one-third of Sentient’s patents, and the focus in our technology review. So what does this mean?
Why does Volt-VAR optimization matter? Imagine a group of houses, all connected to a single grid loop. Nominally, all of them “draw power at 120 Volts”. But in practice, voltage falls off slightly, as you get further from the sub-station (look at the green dots in the chart below). This is because the inevitable creation of electro-magnetic fields “consumes reactive power” (VARs). Park this thought for now.
Sometimes the grid is strained, power prices are very high, and there is a risk of load-shedding. In times like this, it is common for a utility to save energy via “Conservation Voltage Reduction”. If you remember that Power = Voltage x Current, then clearly you can save power by lowering the voltage at the sub-station by 1-5%. It might take a little bit longer for the kettle to boil. But basically nothing is going to break.
What limits Conservation Voltage Reduction is that there is a minimum acceptable voltage. No customer should see their voltage fall below this level. And thus in our image below, we can only lower the voltage at the sub-station by 4 Volts before the ‘pink dots’ below, which tend to be customers furthest from the sub-station, hit the lower limit. But most of the time, a utility is simply guessing here. It has data about the sub-station, which it owns and operates. But it may have hardly any data at all about what is happening downstream of the sub-station.
Enter “Volt-VAR optimization at the grid edge”. The idea is to place dozens of smart optimization devices around the grid. They can detect the voltage in real time, and they can “inject reactive power” to boost voltage at the critical places where voltage is becoming unacceptably low. There have been several studies and over 10,000 deployments of these devices to date. They can typically increase the power savings during Conservation Voltage Reduction by 2-3x. I.e., during times when power grids are under-supplied, total energy savings of 3-5% can safely be achieved, by safely lowering the sub-station voltage, almost imperceptibly for customers.
This also helps smooth the volatility of solar. One study has shown a 72% reduction in voltage volatility from installing a swarm of grid-edge optimization devices. In turn, this kind of improvement in a grid’s ability to tolerate voltage fluctuations can unlock something like 45% more solar hosting capacity. If smart inverters and dynamic voltage controllers are employed together, than the solar hosting capability can be improved by 60%.
Related research, which may be helpful in explaining the terminology in this short note includes our overview of how power grids work, overview of reactive power compensation, long-distance power transmission, transformers and how hot temperatures strain power grids. We think optimization of the power grid is going to be a $1trn pa opportunity in the energy transition.
In conclusion, our technology review for Sentient Energy finds 3-5% energy savings and great solar penetration can be achieved using smart energy systems. Our assessment on Sentient Energy’s technology, the moat in its patents, and further data-points gleaned from its white papers can be found in the data-file below.