Industry Data
-
Global trade: imports and exports, by product, by region?
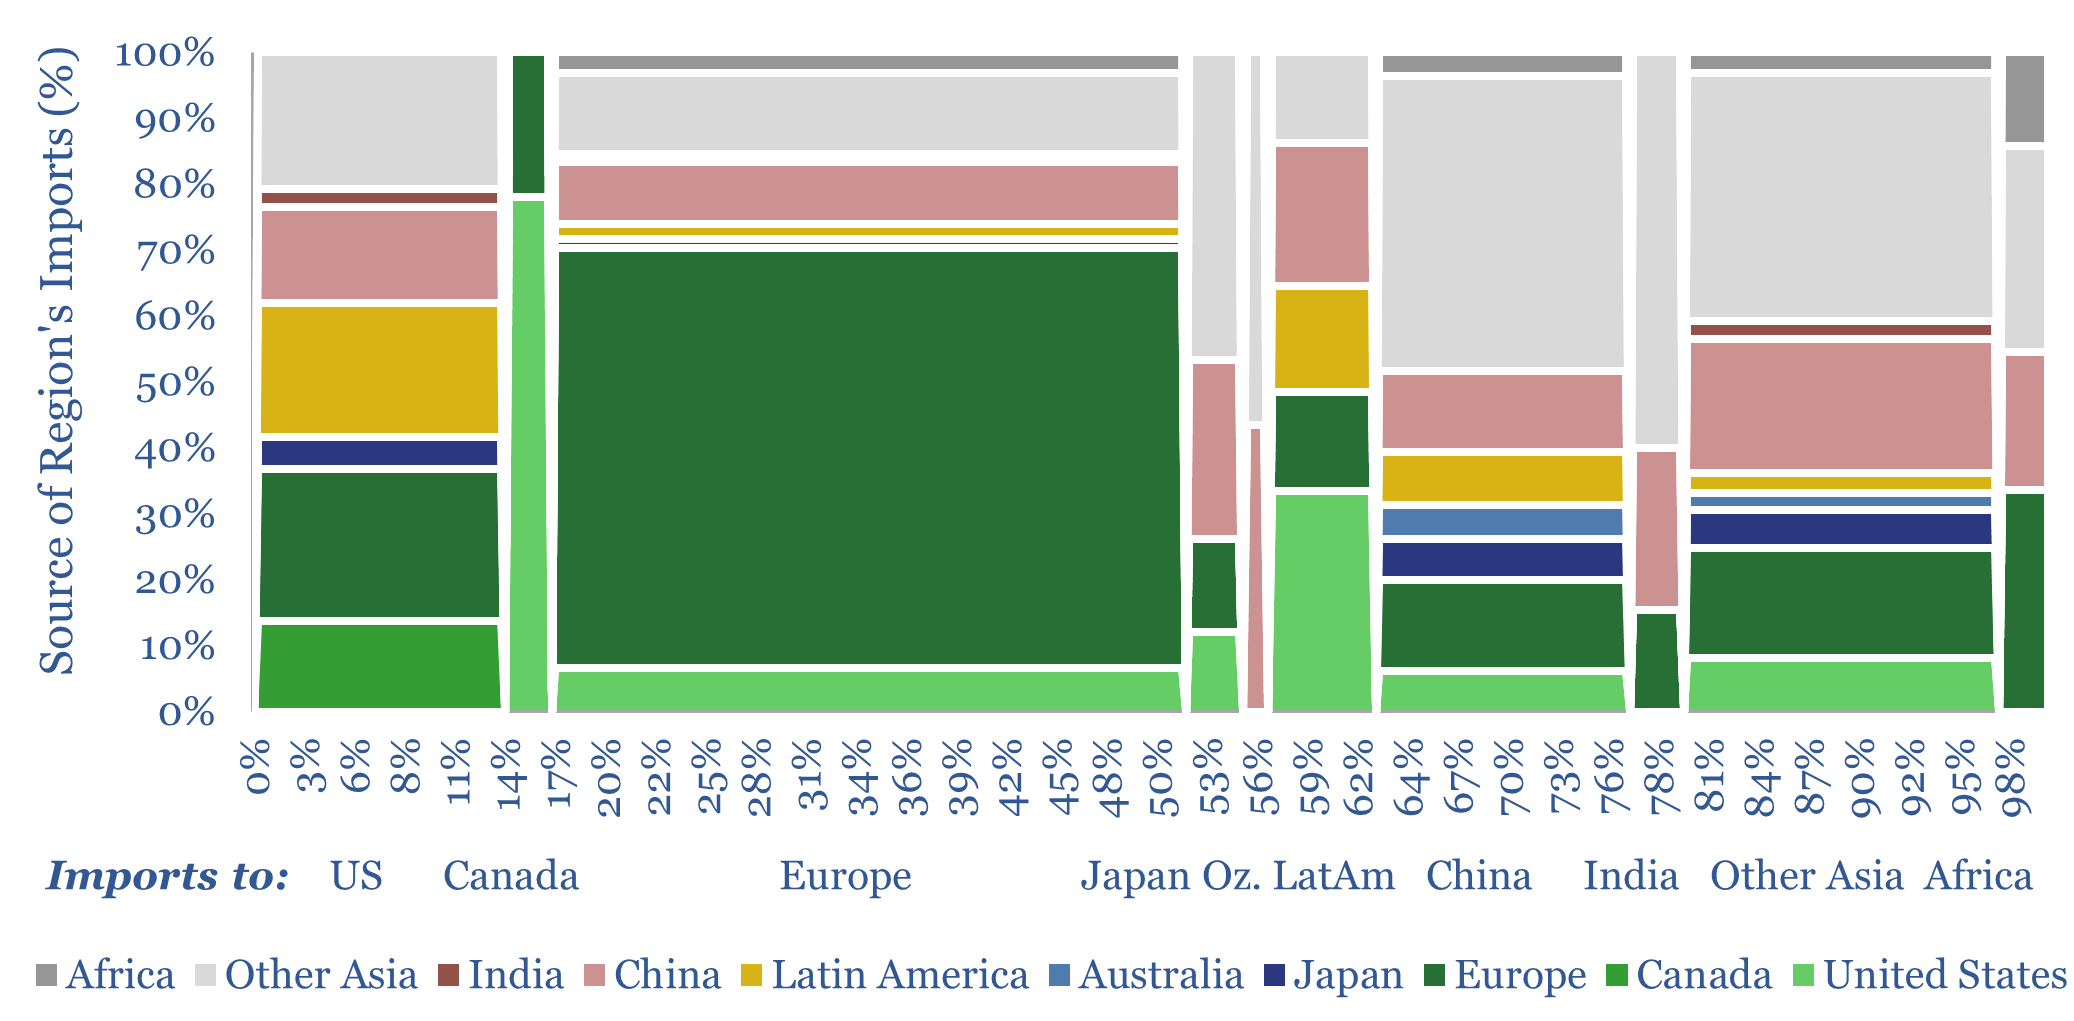
Global trade is set to hit a new peak of $33trn in 2024 (30% of global GDP), of which 70-80% is for goods and 20-30% is for services. This data-file disaggregates global trade by product by region, across c20 categories of energy, materials and capital goods, which we follow in our research, and which are…
-
Water intensity of power generation?
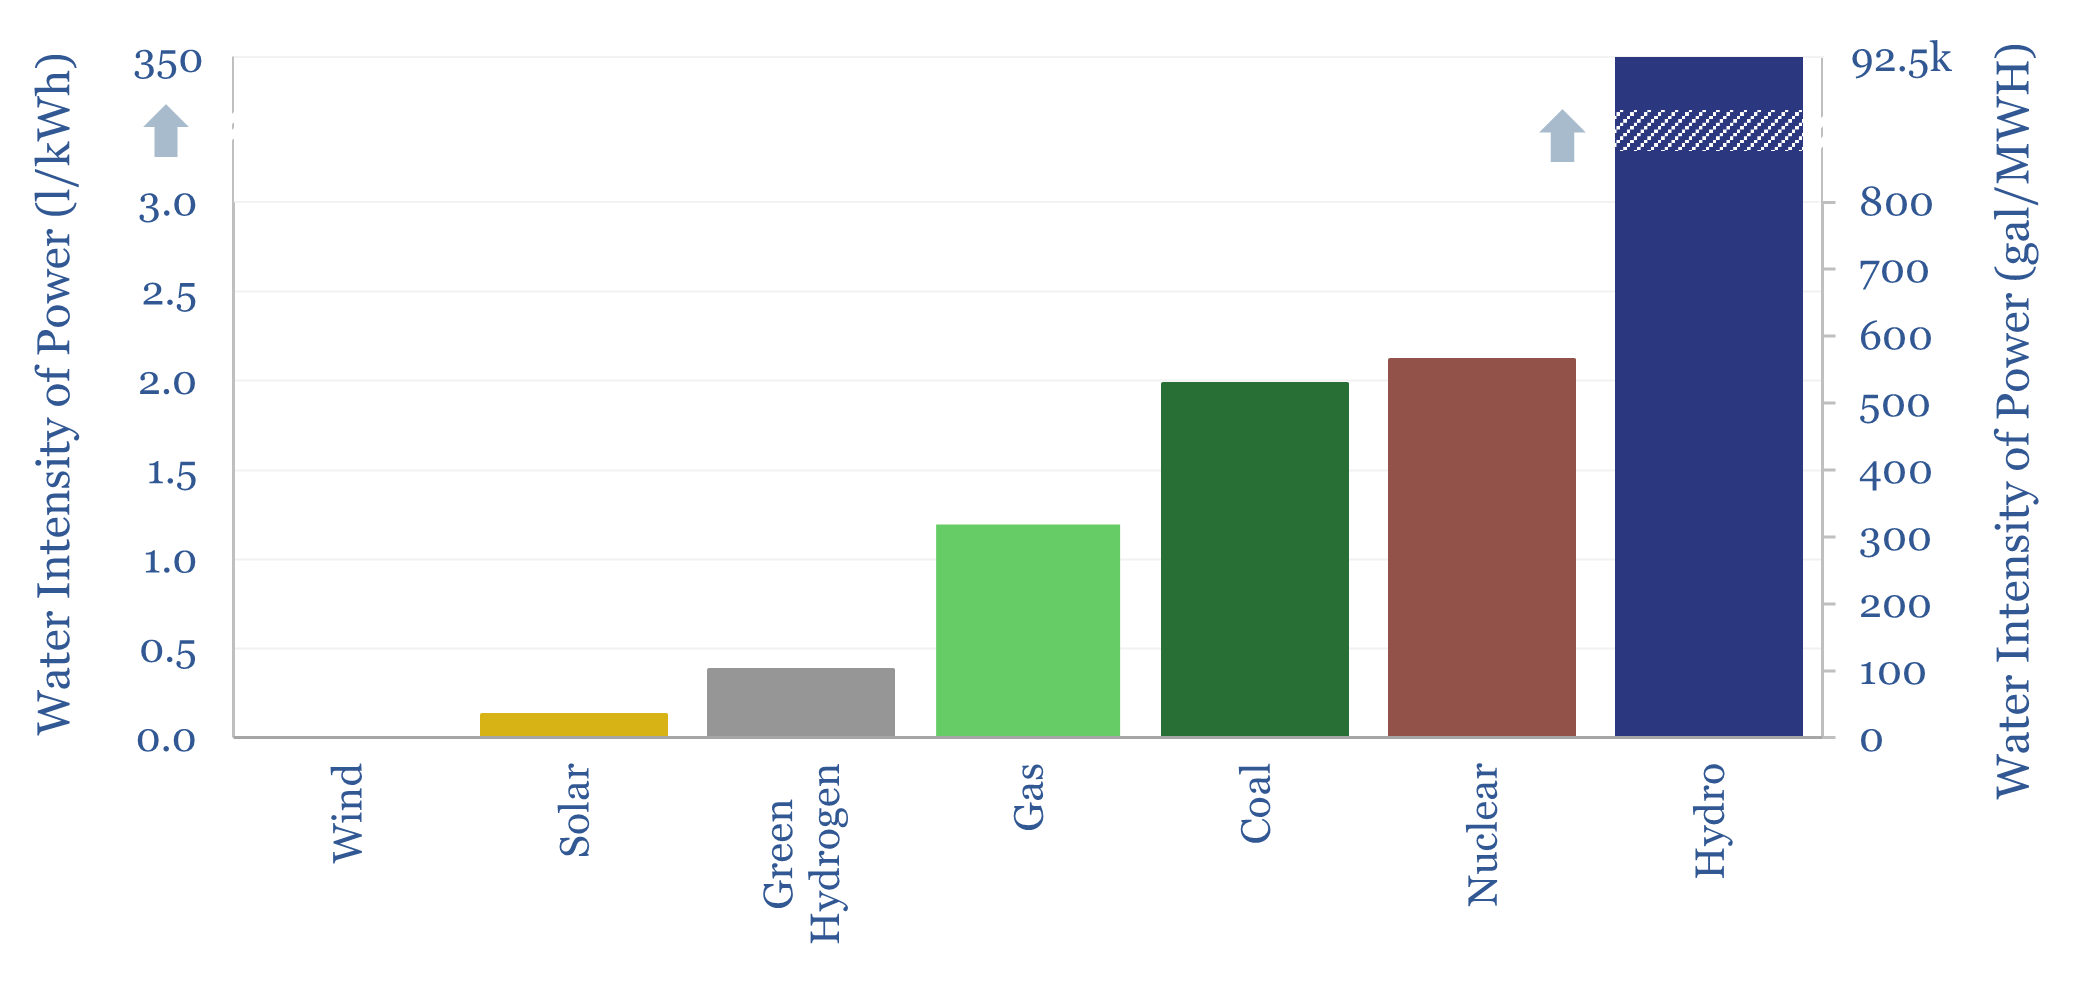
The water intensity of US power generation averages 21 liters per kWh (5,600 gallons per MWH), but 95% of this total comes from evaporation at hydro reservoirs. Excluding hydro power, good estimates are that nuclear power uses 2.1 liters/kWh of water, coal power uses 2 liters/kWh and CCGTs use 1.2 liters/kWh, or less in some…
-
Residential energy prices: reasons for optimism?
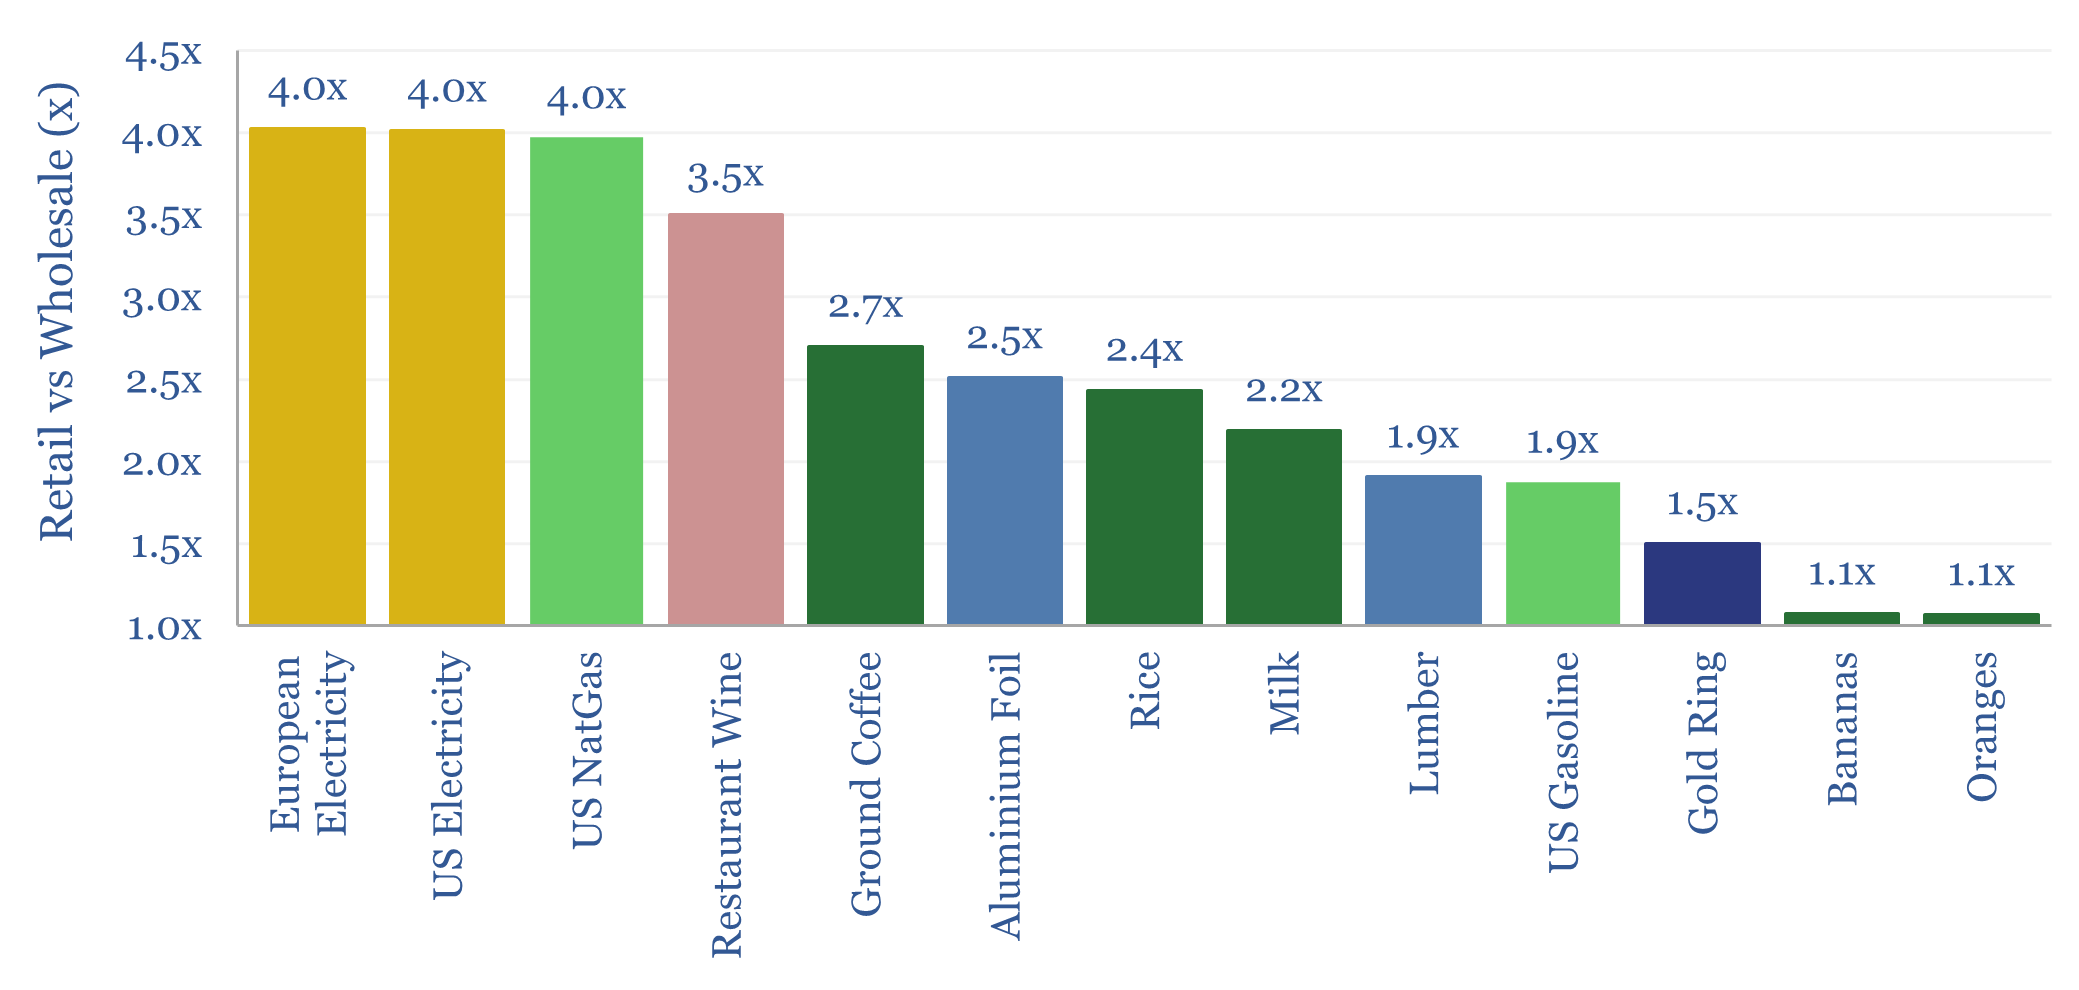
Residential energy prices tend to run 4x higher than underlying wholesale energy prices. This is a very wide margin, as by contrast, typical commoditized products in supermarkets are usually only marked up by about 2x, compared to their wholesale prices. Today’s data-file compares retail prices vs wholesale prices across a dozen different categories.
-
Overview of lasers: by type, market size and efficiency?
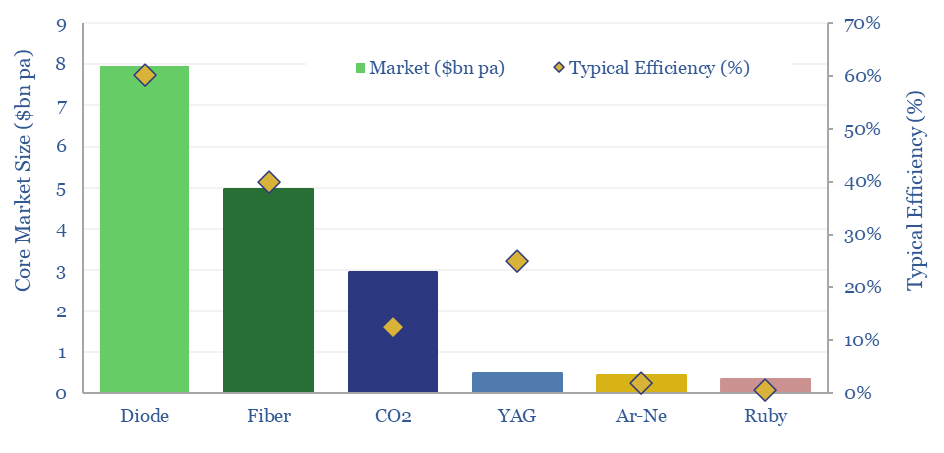
The global laser market is worth $20bn pa, of which half comprises diode lasers mainly used for fiber-optic communications and around 30% is fiber lasers mainly used for cutting, welding and heat-treating materials. These two laser types dominate because of their high, 30-80% efficiencies. This data-file is a brief overview of lasers.
-
LNG plant compression: gas drives vs electric motors?
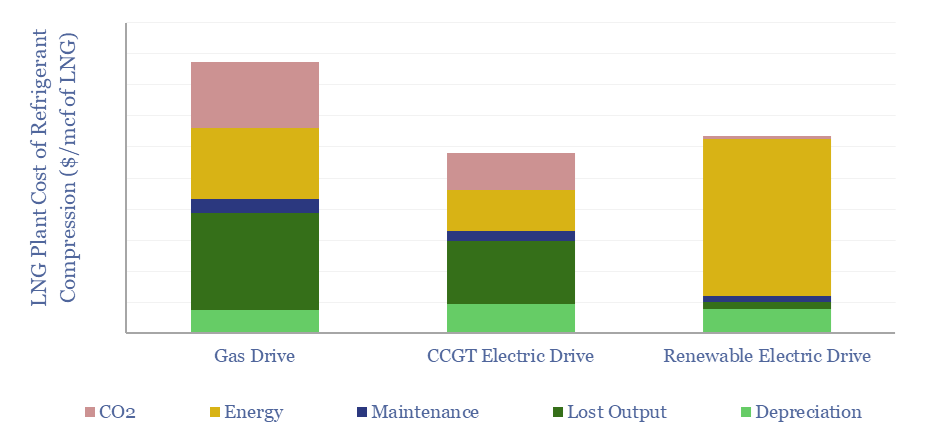
This data-file compares the costs of refrigerant compression at LNG plants, using gas turbines, electric motors powered by on-site CCGTs, or electric motors powered by renewable electricity. eLNG has higher capex costs, but higher efficiency, lower opex, and short payback times. Numbers in $/mcf and $/MTpa can be stress-tested in the data-file.
-
Material and manufacturing costs by region: China vs US vs Europe?
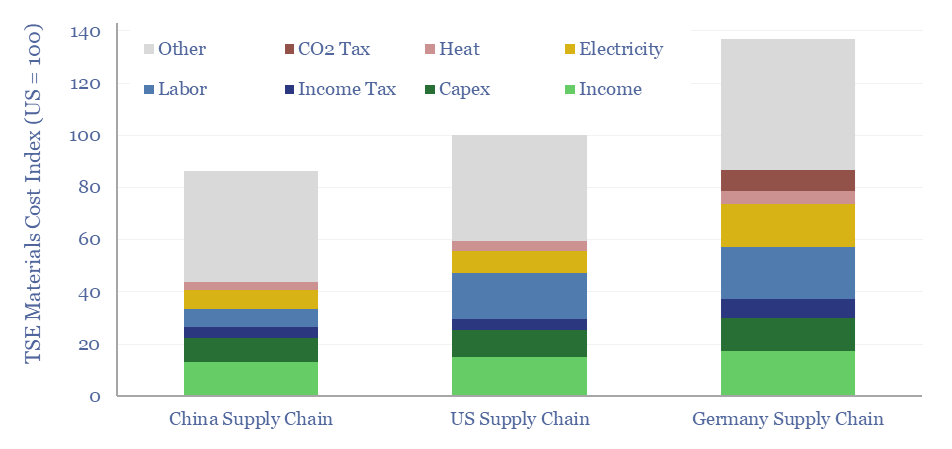
Material and manufacturing costs by region are compared in this data-file for China vs the US vs Europe. Generally, compared with the US, materials costs are 10% lower in China, and 40% higher in Germany, although it depends upon the specific value chain. A dozen different examples are contrasted in this data-file, especially for solar…
-
Decarbonize shipping: alternative fuel costs?
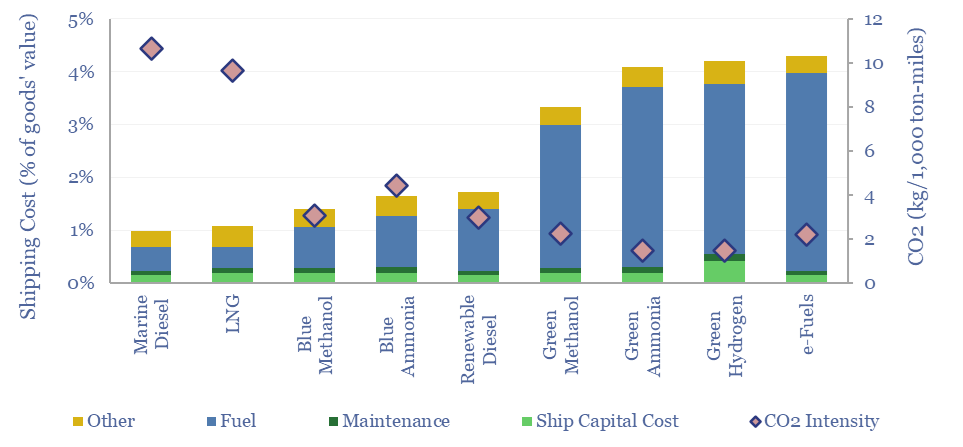
This data-file screens the costs of alternative shipping fuels, such as LNG, blue methanol, blue ammonia, renewable diesel, green methanol, green ammonia, hydrogen and e-fuels versus marine diesel. Shipping costs rise between 10% to 3x, inflating the ultimate costs of products by 0.1-30%, for CO2 abatement costs of $130-1,000/ton. We still prefer CO2 removals.
-
EV incentives: vehicle taxes by country?
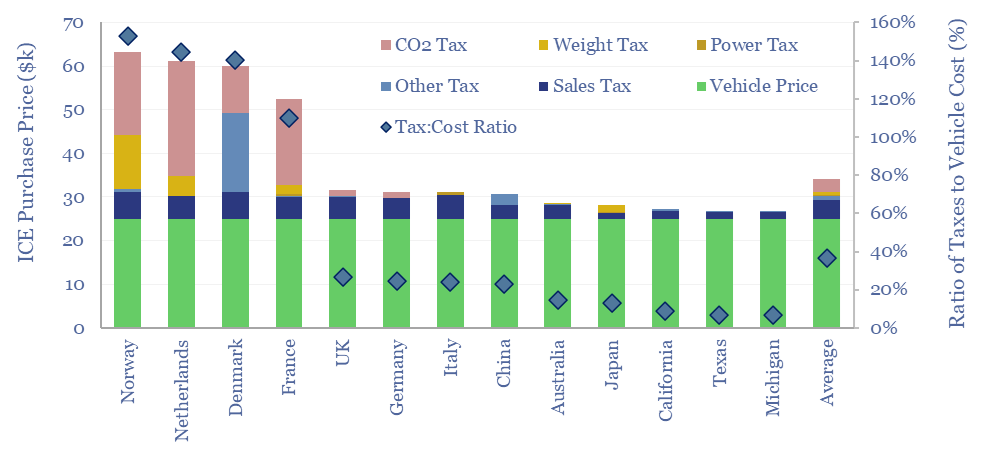
Vehicle taxes by country are tabulated in this data-file, based on vehicles’ pre-tax prices, tailpipe emissions, weight, engine size and power. They range from sub-10% of the cost of the underlying vehicle in the US, through to 150% in Norway, and above 100% in Netherlands, Denmark and France. What implications for EV adoption?
-
Gas distribution: loss rates, leakage, unaccounted gas?
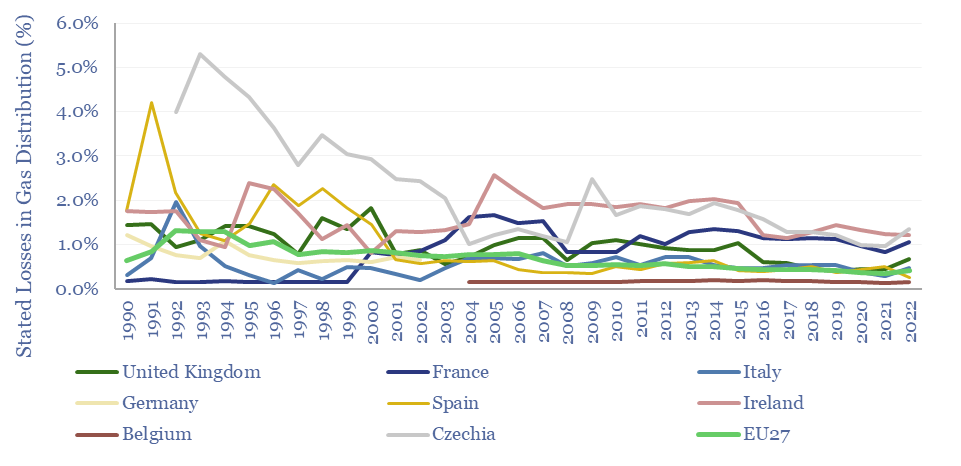
1-4% of all the gas that flows into downstream gas distribution networks may fail to be metered and monetized. Stated leakage rates are usually around 0.5%, but could be higher. This data-file aggregates data from Eurostat and the UK’s Joint Office of Gas Transporters.
-
Power generation: asset lives?
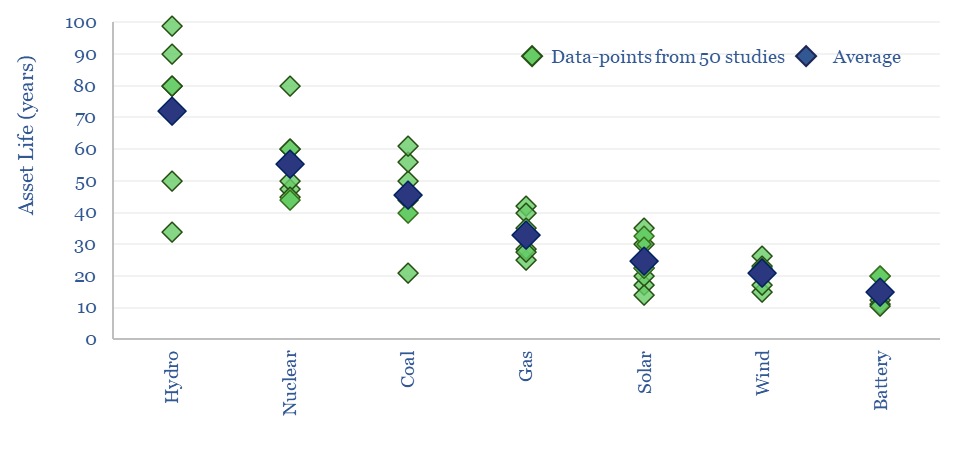
Power generation asset lives average c70-years for large hydro, 55-years for new nuclear, 45-years for coal, 33-years for gas, 20-25 years for wind/solar and 15-years for batteries. This flows through to LCOE models. However, each asset type follows a distribution of possible asset lives, as tabulated and contrasted in this data-file.
Content by Category
- Batteries (96)
- Biofuels (44)
- Carbon Intensity (48)
- CCS (64)
- CO2 Removals (9)
- Coal (44)
- Commentary (65)
- Company Diligence (105)
- Data Models (929)
- Decarbonization (163)
- Demand (132)
- Digital (92)
- Downstream (47)
- Economic Model (222)
- Energy Efficiency (76)
- Hydrogen (63)
- Industry Data (311)
- LNG (56)
- Materials (86)
- Metals (89)
- Midstream (45)
- Natural Gas (163)
- Nature (76)
- Nuclear (28)
- Oil (179)
- Patents (39)
- Plastics (44)
- Power Grids (157)
- Renewables (153)
- Screen (139)
- Semiconductors (36)
- Shale (58)
- Solar (73)
- Supply-Demand (53)
- Vehicles (94)
- Video (24)
- Wind (46)
- Written Research (411)