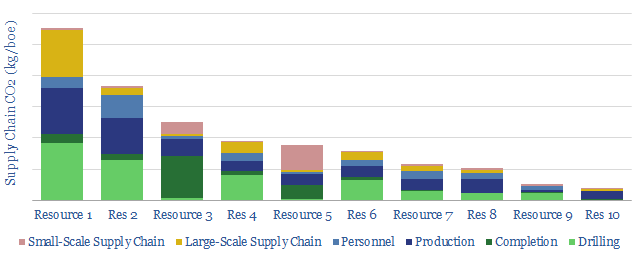
This data-file calculates the CO2 intensity of oilfield supply chains, across ten different resources, as materials are transported to drilling rigs, frac crews, production platforms and well pads.
Different resources can be ranked on this measure of supply chain CO2-intensity: such as the Permian, the Gulf of Mexico, offshore Norway, Guyana, pre-salt Brazil and Middle East onshore production (chart above).
Underlying the calculations are modeling assumptions, for both onshore and offshore operations, each based on c15 input variables. You can change the inputs to run your own scenarios, or test the most effective ways to lower supply-chain CO2.
