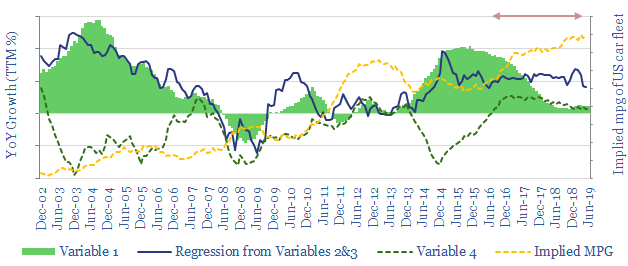
This data-file breaks down US gasoline demand, as a function of vehicle miles traveled (urban and rural), GDP growth, gasoline prices and fuel economy across the US vehicle fleet. It contains monthly data on each variable, going back to 2002, so correlations can be explored.
Gasoline demand is modestly slower-than-expected in 2019, rising just +1.0% YoY, which is above the prior 15-year trend for 0.4% pa growth, but below the 1.8% expected basesd on regressions to fuel prices and GDP.
One cause is urban vehicle miles driven, where growth has slowed, defying historical correlations with GDP (strong) and gasoline prices (reasonable). Structural explanations could include the rapid rise of alternative vehicles (e.g., e-scooters), ride-sharing and policy decisions.
Please download the file to view the data or test your own regressions.
