Gas power generation data are aggregated in this data-file, covering ten of the largest CCGTs and gas peaker plants in Australia, across five-minute intervals, in May-2024 and in May-2014. This makes for a fascinating case study into how gas turbines are used to stabilize power grids, backstop renewables, and how this has changed over time.
AEMO is Australia’s Energy Market Operator. It maintains a fantastic data portal, with multiple TB of available data, including the generation of every facility in the power grid, at five-minute intervals.
The biggest challenge for understanding gas power generation is the amount of data. A single month contains 9,000 x 5-minute intervals.
Hence we have selected ten of the largest gas generation facilities, and studied their output in both May-2014 and May-2024 as case studies. And even this limited exercise ended up yielding a 24MB data-file!
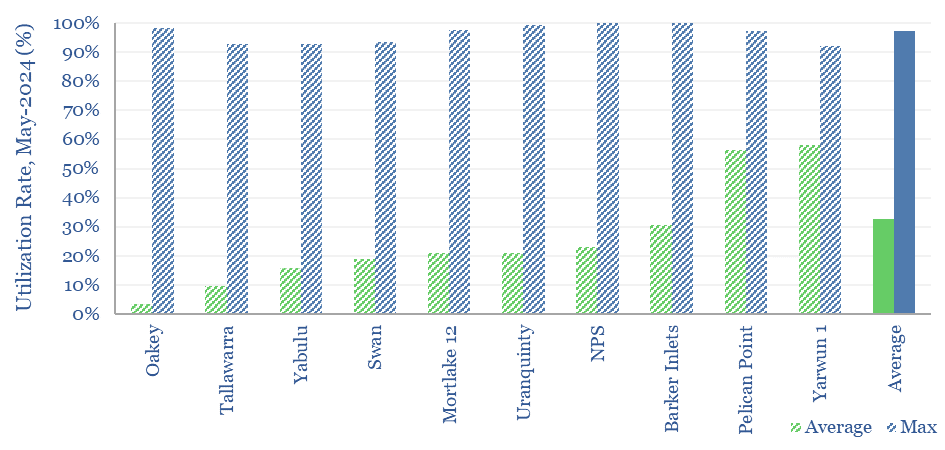
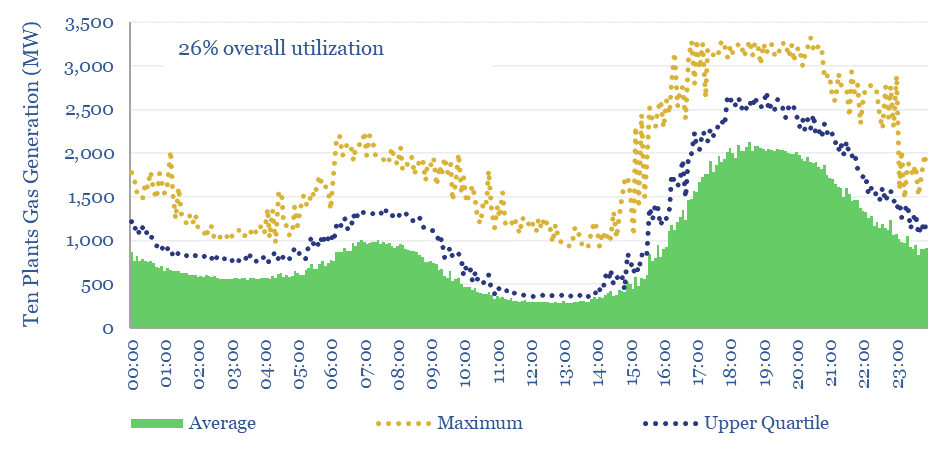
In May-2024 the average gas turbine ran at 26% utilization, which is lower than the base case in our gas generation economic model.
However the average turbine also ran 90% of its nameplate capacity across 10% of the hours, and peaked at 96% of its nameplate capacity when the regional grid was running short (chart below).
The daily pattern of gas generation in the Australian power grid shows a sharp drop in the middle of the day, to accommodate solar, while these plants then ramp sharply in the evening, in extremis ramping up to 90% of their total aggregate capacity. Can this really be replicated by batteries?
Gas power generation also varies widely, from baseload plants running at 90% utilization through to peaker plants that fire for just a few hours per month and thus run at just 1% utilization.
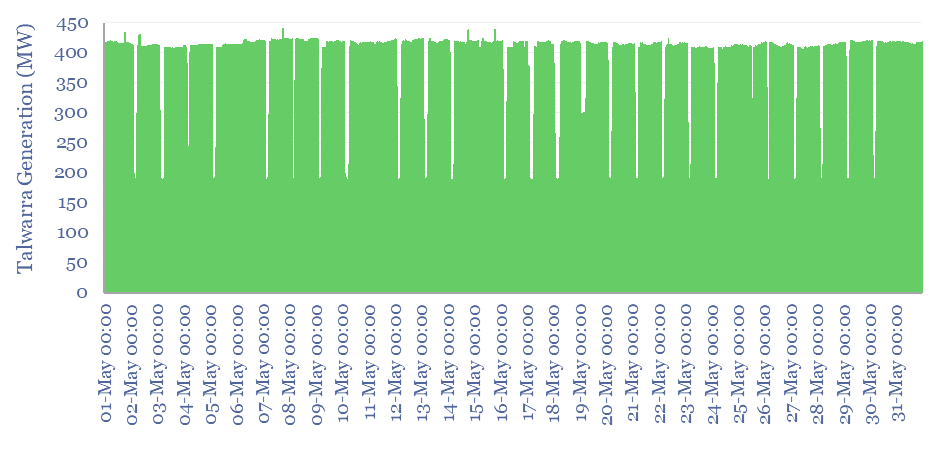
As an example of a baseload generator, the chart below shows the output from the 440MW Tallawarra-1 CCGT in May-2014, running at 90% utilization, at >50% efficiency, with output typically dipping from 1-5am, when daily demand troughs.
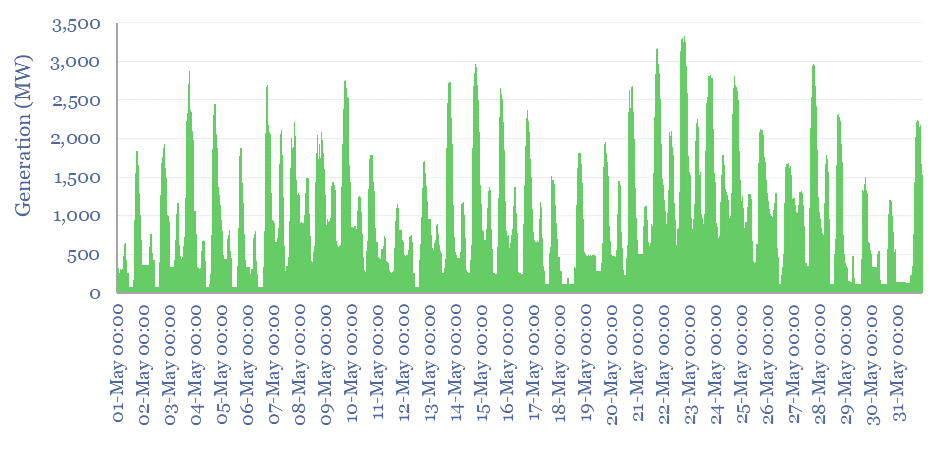
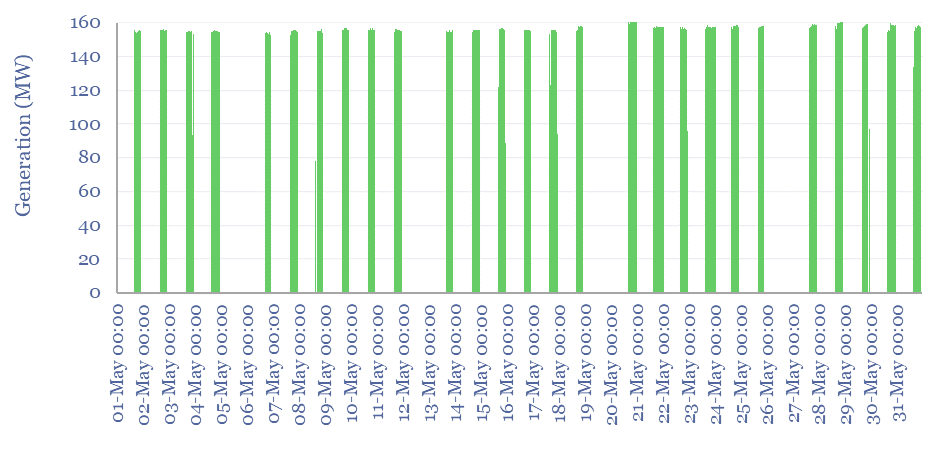
As an example of a peakload generator, the chart below shows the output from the 160MW Townsville CCGT, at Yabulu, in May-2024, firing up for 5-hours most days, from 4-9pm, sometimes longer. The total utilization rate for the month is 16%, but when the plant does run, then it is running above 90% of its nameplate capacity 93% of the time.
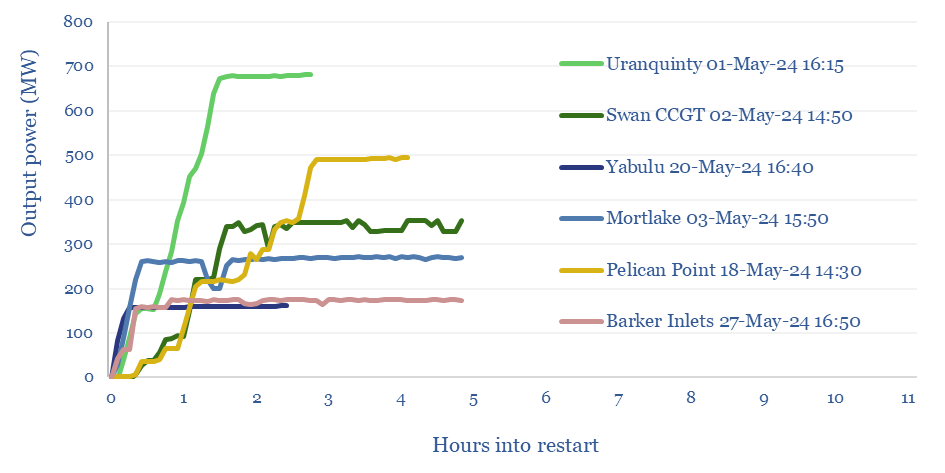
Another key reason that gas plants help to backstop renewables volatility is their rapid responsiveness. Smaller simple-cycle turbines can ramp from a cold start within 20-30 minutes, while larger CCGTs can ramp from a cold-start within 1-3 hours (chart below). For contrast, ramping coal plants from a cold start takes 4-8 hours, based on our case study into coal generation profiles.
The data-file illustrates gas power generation, across minute-by-minute, hour-by-hour volatility intervals, for ten facilities, in May-2014 and May-2024. Grids are relying increasingly on gas backups.
We are happy to help TSE clients set themselves up to pull data from the AEMO database, in order to run their own analyses. Please contact us if we can help you on this front.