Load profiles depict how the power running through a particular cross-section of the grid varies over time, ranging from individual homes, through giant GVA-scale transmission lines. Load profile data are unfortunately not widely available, however, we have aggregated a dozen case studies from technical papers, in this data-file, to help decision-makers with grid-modeling.
Load profiles are almost always lognormally distributed, across the technical papers we have reviewed, which means that the logarithm of load is normally distributed, the minimum load is zero, and upside variability is much higher than downside variability. This is visible in the two charts below, where we have fitted a curve over load profiles from substations.
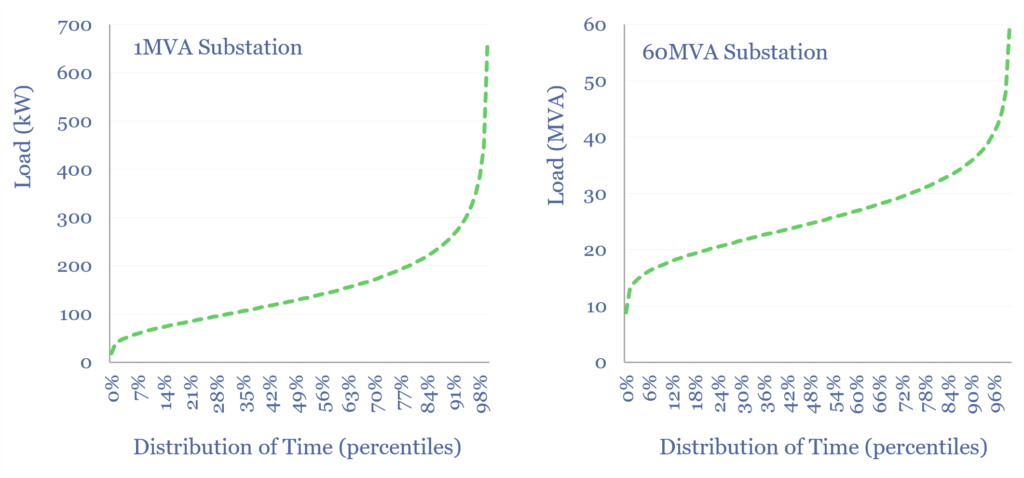
The distribution of load profiles means that when a sub-station or distribution line needs to be upgraded, it is not because the line is generally overloaded. In fact, the average node in our data-file runs at an average utilization of 30%, ranging from 10% at individual residential properties to 60-70% at some large substations.
Rather, when a sub-station or distribution line needs to be upgraded, it is most likely because it could become overloaded, during the upper 1% of times of peak demand. It is economically very inefficient if you need to go out and expand an entire T&D loop, just to keep the lights on in this upper 1% of challenging hours.
This creates an opportunity for batteries. Upgrading a 10km distribution line might cost $2,000/kVA, while a 4-hour grid-scale battery might cost $1,000/kVA (fully installed) and simply needs to be mostly charged before periods of potentially high demand, as a kind of insurance policy. You might also get some resiliency and power quality benefits for free.
It also creates an opportunity for load shifting, where consumers across the grid may commit to lower their demand at peak times, and sell this promise within capacity markets. Again, paying some consumers a flat fee to curtail their demand at specific times may be much cheaper than having to expand the grid (or build batteries).
Generally, we found that utilization rates are lower and variability is higher in smaller and residential grid infrastructure, while utilization rates are higher and variability is lower at large and industrial grid infrastructure.
Load shifting may be valuable across the grid, but particularly so at the level of individual homes and smaller grid loops (e.g., as enabled by smart energy services, per our case study here), and it could also make more sense to install batteries closer to these consumers.
Underlying data, and our best fit curves in individual contexts, are in the data-file.