This data-file decomposes the drivers of shale productivity in Alberta’s Duvernay play, across a correlation-matrix of 23 different variables.
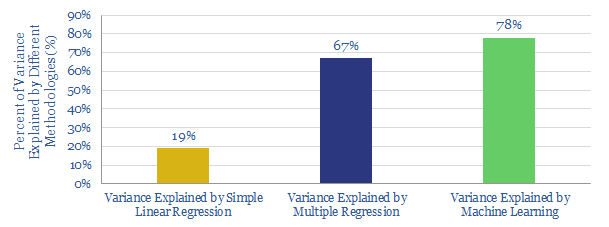
Machine learning can be used to predict 78% of the variance in wells’ performance from this data-set, surpassing the 19-67% predictive power of regression models (chart above). Accordingly, $1M/well savings are suggested, while well productivity can improve by 19-97%.
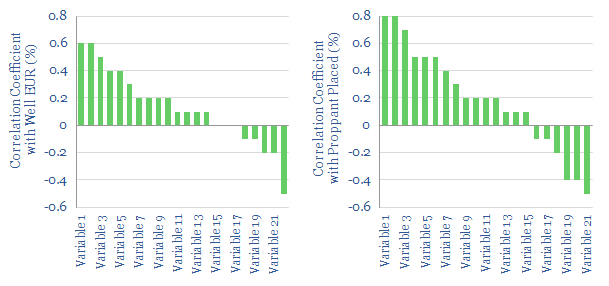
Shale is a data industry. “Big data” approaches are the only way to capture the complex inter-correlations within shale’s productivity drivers. As shown below, well EURs are meaningfully correlated with 12 variables. The “largest” driver is “proppant placed”, which is itself meaningfully correlated with 16 other variables.
Machine learning is still in its infancy in the shale patch, representing c2% of total industry-research. It presents material upside.