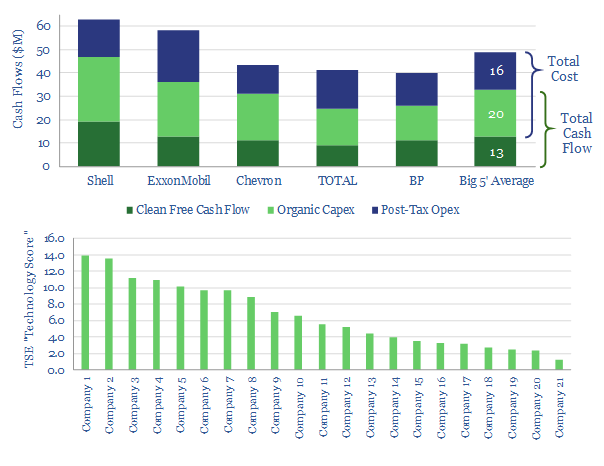
This data-file tabulates the approximate cash flow, capex and ‘pre-tax costs’ of Oil Majors, in order to illustrate the operational leverage within the group. Every $1 of free cash flow comes after $3 of cost. Hence small reductions in the cost base, through technology, deliver 3x larger uplifts to free cash flow. This is why we are screening Oil companies’ technology-capabilities.