This data-file aims to estimate the power capacity required for a typical home circa 2010, 2020 and 2030, under various energy transition scenarios. It also contains real-world load data on a typical UK home, showing the distribution of loads and the disaggregation by appliance.
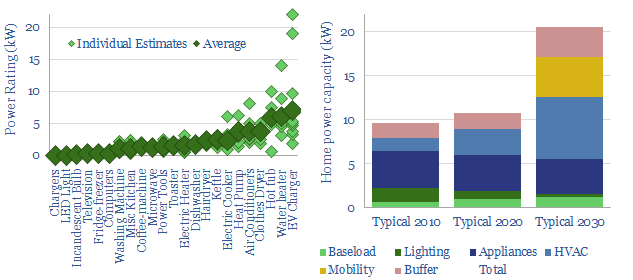
Our methodology in this data-file is to tabulate the typical power consumption of various appliances, then estimate the number of these appliances that would be required by homes, depending on the way they use electricity.
A typical home in the developed world currently has a 10kW maximum power capacity before tripping its circuit-breaker (although it varies).
This could easily double in the energy transition, due to phasing back gas heating, gas cooking and the addition of home charging stations for electric vehicles.
The only thing is that upgrading the power capacity of a home can typically cost $1,000-5,000, and sometimes as much as $20,000.
We think that constructing more resilient power grids will be a crucial component of the energy transition, and total global power grid capex could quadruple to over $1trn per year.
The data-file contains our estimates for the typical power consumption (in Watts) for 30 types of electronic devices, such as Air Conditioners, Ceiling fans, Chargers, Clothes Dryers, Coffee-machines, Computers, Dishwashers, Electric Cookers, Electric Heaters, Electric Ovens, EV Chargers, Fridge-freezers, Hairdryers, Heat Pumps, Hot tubs, Incandescent Bulbs, Irons, Kettles, LED Lights, Microwaves, Misc Kitchens, Power Tools, Routers, Saunas, Televisions, Toasters, Vacuum Cleaners, Washing Machines, Water heaters.
The data-file also contains estimates for the power factors, total harmonic distortion and fundamental RMS of different types of loads. An electric kettle might have less than 2% total harmonic distortion and 0.99 power factor, while a laptop has 150% total harmonic distortion and 0.57.
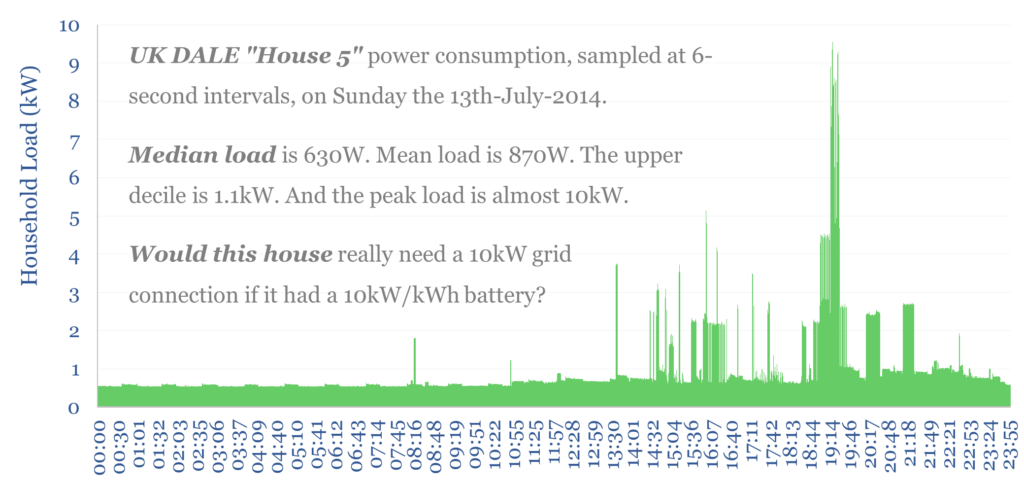
For a real-world perspective, we have aggregated data into the load profile of a UK home, based on the open-source UK Domestic Appliance Level Electricity (UK-DALE) data-set. This shows how loads vary over time, are log-normally distributed, and spike infrequently when multiple appliances are run simultaneously. The underlying DALE data run to several GB of file size, and are not included here. So please do contact us if we can help you to run some bespoke analysis on this data-set.
For a further real-world perspective, we have averaged and categorized data from the Smart* NILM study, for a 1,700 square foot home in Massachusetts, over several days, including the fridge, freezer, AC, ventilation (inc around the boiler/water heater), lights, washer, dryer, dishwasher, microwave, other kitchen appliances and other appliances. The AC unit is c50% of the home’s electricity consumption on the day charted below, but the dryer actually makes the biggest contribution to the house’s peak load, both within and between days (charts below).
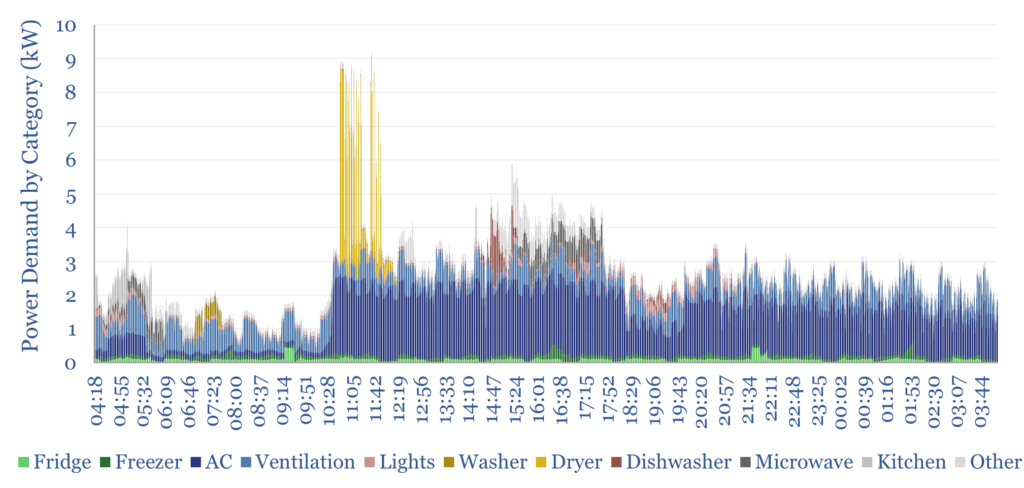
Citation: Barker, S., Mishra, A., Irwin, D., Cecchet, E & Shenoy, P. (2012). Smart*: An Open Data Set and Tools for Enabling Research in Sustainable Homes.