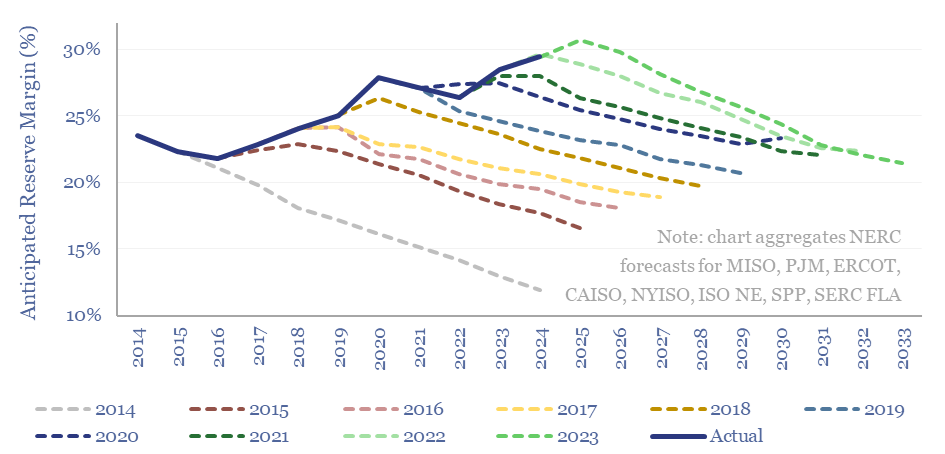
Reserve margins across major ISOs in the US power grid average 29% in 2024, are seen declining to 21% in the next decade by NERC, but could decline further, falling below their recommended floors of at least 15%. Possible reasons include demand surprising to the upside, or controversies in the capacity contributions of renewables. This data-file tabulates reserve margin forecasts, by ISO region, and over time.
Reserve margins are calculated by dividing (a) total power generation resources (in MW) that are seen to be available during times of peak grid demand by (b) total anticipated peak grid demand (in MW). Then subtract 1 to yield a percentage figure.
NERC guidelines recommend keeping reserve margins well above 15%, in order to limit Loss of Load Expectations (LOLE) to 1 event per 10-years, as part of resilient power grids.
Aggregated across major US ISOs, reserve margins currently average 29% in 2024, are projected by NERC to decline to 21% in the next decade, but could decline further if power demand surprises to the upside, or resource additions are delayed or disappoint.
This data-file aggregates NERC’s reserve margin forecasts over time, for major ISOs in the US, such as MISO, PJM, ERCOT, CAISO, NYISO, ISO NE, SPP and SERC FLA. Underlying charts are available on a separate tab for each region. We have aggregaed all the regions together in the charts above.
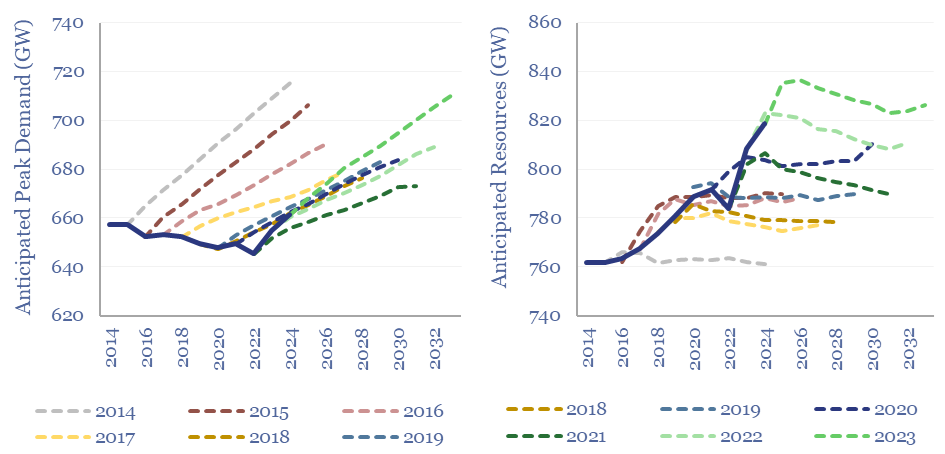
In each case, we have plotted expectations for peak demand, net demand after demand responses and anticipated resources, which in turn comprise existing firm resources plus Tier 1 capacity additions.
In the past, reserve margins have defied pessimistic projections. The main reason has been downwards reivisions in demand, and upwards revisions in renewables resources. What is changing is that demand is now surprising to the upside, linked to the rise of EVs and the rise of AI.
Another controversy in measure reserve margins is how to count the capacity from renewables. 100MW of gas generation is almost always available to provide 100MW. We think the forecasts from NERC and from underlying ISOs may be ascribing 50-60MW of availability per 100MW of renewables. But due to the intercorrelation of renewables, and especially as renewables get built out, this may turn out to be too high.
The underlying source of the data is from NERC’s annual long-term reliability assessments.