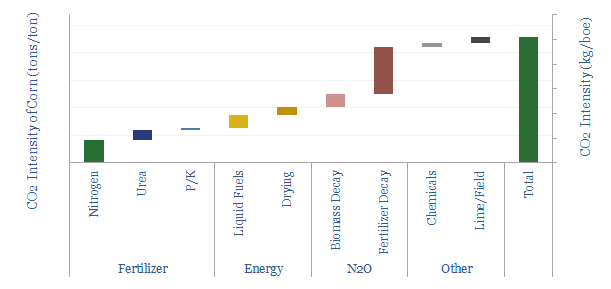
Crop production: what CO2 intensity?

CO2 intensity of crop production

The CO2 intensity of crop production is broken down in this datafile. We have focused our numbers on corn production, as it is the world’s largest crop, with production of around 1.2 GTpa, or c5,500 TWH of primary energy. (Amazingly, corn thus comprises about 25% of all human food-energy production; and 3% of all total human energy production, 2x more than all wind and solar energy in 2021 combined).


The CO2 intensity of producing corn averages 0.23 tons/ton, or 75kg/boe. This is relatively low, compared to industrial commodities, that tend to range from 0.5 – 150 tons/ton CO2 intensity, across our economic models.

The largest component of crop’s CO2 intensity, at c50% of the total, is N2O emissions, as c0.3-3.0% of all nitrogen fertilizers break down into N2O (per the IPCC). N2O is a greenhouse gas with 298x higher global warming potential than CO2, which explains around 7% of total US greenhouse gas emissions (per the EPA).

Another 30% of the total emissions footprint for producing crops is from producing fertilizers themselves, such as ammonia and urea.

Another 10% is liquid fuels, mainly diesel, used in farm machinery, for tillage, sewing seeds, harvesting crops and transporting them to a processing/storage facility.

Our base case estimate of 75kg/boe of Scope 1+2 CO2 intensity for crop production is interesting, as it is actually higher than the Scope 1+2 CO2 intensity of producing oil and CO2 intensity of producing gas.

The energy return on energy invested for crop production is around 12x on this model. Or in other words, for each 1 kWh of energy in the corn crop, around 0.09 kWh must be supplied, of which c6pp is in the form of natural gas and 3pp is in the form of oil products, mainly diesel. It is sometimes said that the modern agricultural system can be described as the conversion of fossil energy into food energy. Or numbers would suggest this statement is about 9% true!

Implications for biofuels. Making 1 boe of bio-ethanol requires around 2 boe of corn, plus additional gas, electricity and the re-release of CO2 from fermentation. Thus we can compile a total look-through CO2 footprint for corn ethanol, including data from actual bio-ethanol plants and our corn ethanol economic model. We think the Scope 1-3 CO2 of corn ethanol is 240kg/boe, or around 50% below conventional oil products. Although this does not include opportunity costs of biofuels, for example, the potential to re-forest croplands growing corn for ethanol, which could abate over 5 tons of CO2 per acre per year.

All of our numbers can be stress-tested in the data-file. The numbers can vary markedly, from 0.1 – 0.4 tons CO2/ton of corn; or in other words, from 40kg/boe to 160kg/boe. Agricultural improvements remain an important part of the energy transition.

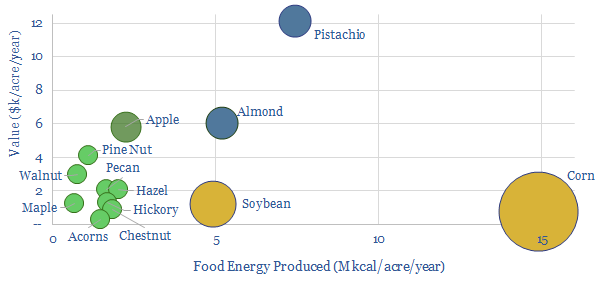
Tree crops: financial and agricultural yields?

Tree crop versus conventional agriculture

This data-file compiles the estimated calorific and financial yields of tree crops versus conventional crops such as corn and soybean. There is strong economic potential to produce food while absorbing CO2 in trees,  although calorific  yields are 50-90% lower.

On average, conventional agricultural will yield high calorific yields of 5-15M kcal and moderate value of $1,000 per acre, after decades of agricultural improvements.

Heavily ‘farmed’ tree crops, such as almond and pistachio will have calorific yields in the low end of this range, but generate 5-10x more value per acre.

Less intensively farmed tree crops will produce 1-2M kcal per acre, but their value is nevertheless around 2x higher than conventional agriculture.

Species-by-species considerations are discussed in the data-file.

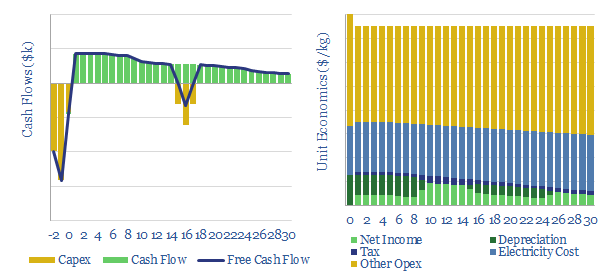
Vertical greenhouses: the economics?

Economic costs of vertical greenhouses

This data-file models the vertical greenhouse costs, an emerging method for growing greens, fruits and vegetables close to the consumer, in large multi-story facilities, lit by LED lighting. Economics can be attractive, with 10% IRRs in our base case condition, off 50kg/m2/year yields and $7.5/kg produce pricing.


Vertical greenhouses achieve 10-400x greater yields per acre than field-growing, by stacking layers of plants indoors, and illuminating each layer with LEDs. The opportunity is covered in our vertical greenhouse research note.

The main rationale for vertical greenhouses is to maximize land productivity, situate production closer to the consumer and earn a premium from fresher produce.

Historically, vertical farming was first described in 1915 by American geologist, Gilbert Ellis Bailey. The first vertical farms were actually built in the 1950s, to grow cress indoors at large scale. LED application for plant growth was first studied in the 1990s, as part of NASA’s preparations for future Moon and Mars bases. And modern experiments with vertical farms go back to 2009, when Sky Green Farms designed a 9-meter arrange of 120 aluminium towers to grow 0.5T of leafy vegetables per day.

Economics of vertical greenhouses can be attractive, with 10% IRRs in our base case condition, off 50kg/m2/year yields and $7.5/kg produce pricing.

However the CO2 intensity will depend heavily upon the CO2 intensity of the underlying grid,  as our numbers assume 1,000kWh/m2/year of LED light is required.

LED-lighting vertical greenhouses takes 1,000kWh of electricity per m2 per year, emitting 3kg of CO2 per kg of food, if the grid is 50% gas and 50% renewables.

CO2 costs of vertical greenhouses can also be compared with field crop production.

Data in thos models cover the typical capex, opex, energy costs and other vertical greenhouse costs, sourced from technical papers, which are also summarized in the final three tabs of the model.

Backstopping renewables is another opportunity for vertical greenhouses, as LED lights can readily be turned on and off, adding flexibility to power grids.

Vertical greenhouses could become carbon negative, if they are >75% powered by renewables, and increase yields per acre by c300x, as claimed by some

CO2 enrichment is another opportunity, absorbing excess CO2 to improve yields, as a variant on other CCS value chains.

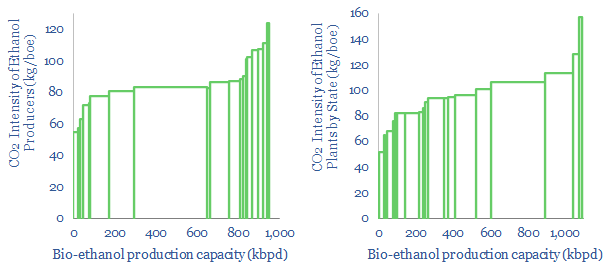
US ethanol plants: what CO2 intensity?

CO2 intensity of ethanol

This data-file tabulates the CO2 emissions from US ethanol plants, which produce around 1Mbpd of liquid fuels, giving an average CO2 intensity of ethanol of 85kg/boe.


In addition, we estimate 75kg/boe is emitted in producing corn, and around 2 boe of corn are needed to make 1 boe of ethanol.

Thus bio-ethanol has a total CO2 intensity of 240kg/boe (this is c40-50% less than conventional oil products, on a fully-loaded Scope 1-3 basis).

Our data are based on granular disclosures from 170 separate facilities, which have reported to the EPA FLIGHT tool and to the EIA.

Hence we can use the data to screen for the CO2 intensity of ethanol production state by state and company by company.

Covered companies, ranked by ethanol capacity, include Poet, Valero, Great Plains, Koch, Marathon and White Energy.

CO2 intensity below 60kg/boe can be considered as ‘lower carbon’ while CO2 intensity above 90kg/boe would be considered ‘higher carbon’.

The data-file also breaks down 170 different ethanol production facilities in the US, facility-by-facility. There is c300kbpd in Iowa, and over 100kbpd in boh Illinois and Iowa.

The industry-leading ethanol producer is highlighted and discussed in this article  that was sent out to our distribution list.

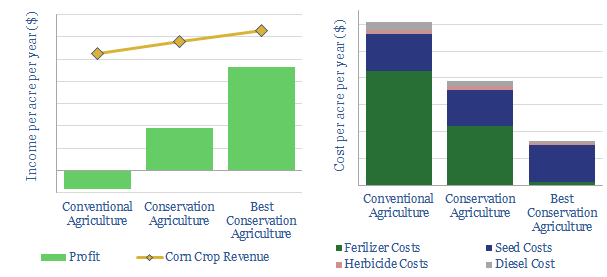
Restoring soil carbon: the economics?

economics of restoring soil carbon

This model illustrates the economics for conservation agriculture, restoring soil carbon to improve agricultural yields, while also sequestering 5-30T of CO2 per acre per year.

Agricultural economics are transformed from marginal to material, as yields improve 10-20% and costs fall 36-73%, including the potential elimination of fertilizer application.

Please download the model to stress-test input assumptions into corn prices, fertilizer prices, diesel prices and CO2 prices; as well as yields and soil carbon uptake rates.

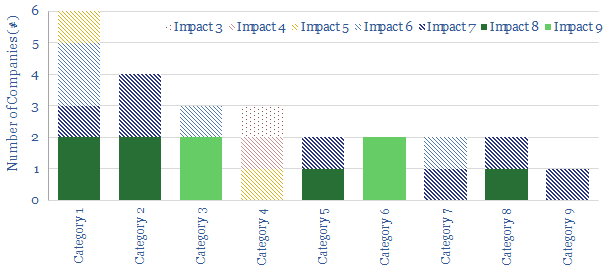
Make CO2 into valuable products?

Make CO2 into valuable products

This data-file is a screen of 27 companies, which are turning CO2 into valuable products, such as next-generation plastics, foams, concretes, specialty chemicals and agricultural products.


For each company, we have assessed the commercial potential, technical readiness, partners, size, geography and other key parameters. 13 companies have very strong commercial potential. 10 concepts are technically ready (up from 8 as assessed in mid-2019),  6 are near-commercial (up from 5 in mid-2019), while 13 are earlier-stage.

A detailed breakdown is also provided for the opportunity to use CO2 enhancing the yields of commercial greenhouses (chart below).

The featured companies include c21 start-ups. But leading listed companies include BP (as a venture partner), Chevron Phillips, Covestro, Repsol, Shell, TOTAL (as a venture partner) and Saudi Aramco.

Copyright: Thunder Said Energy, 2019-2024.