Batteries
-
Energy storage: top conclusions into batteries?
Thunder Said Energy is a research firm focused on economic opportunities that can drive the energy transition. Our top ten conclusions into batteries and energy storage are summarized below, looking across all of our research.
-
Economics of flywheels: fast frequency response?
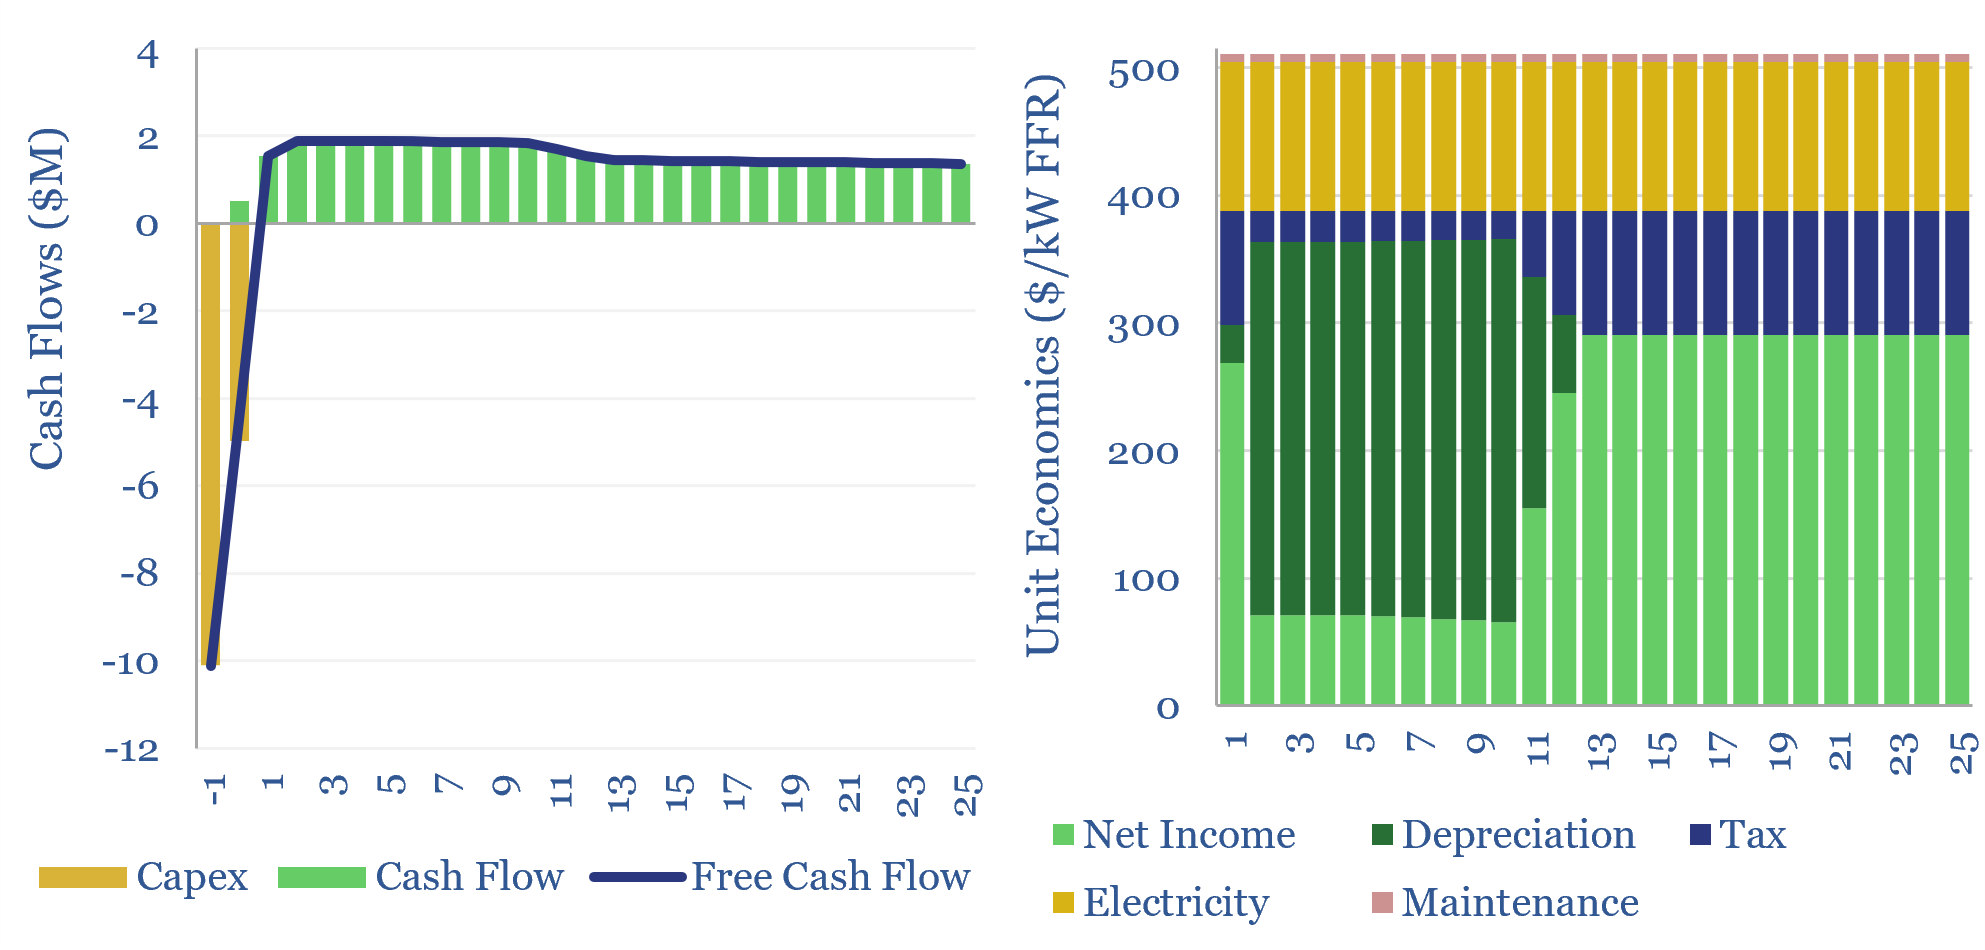
The economics of flywheels can be stress-tested in this data-file, requiring a $500/kW fee for fast-frequency response, to generate a 10% IRR on c$10,000/kWh of capex costs, on a typical flywheel plant with around 15-minutes of energy storage. The rise of renewables and AI increasingly requires adding inertia to power grids. Flywheels may be one…
-
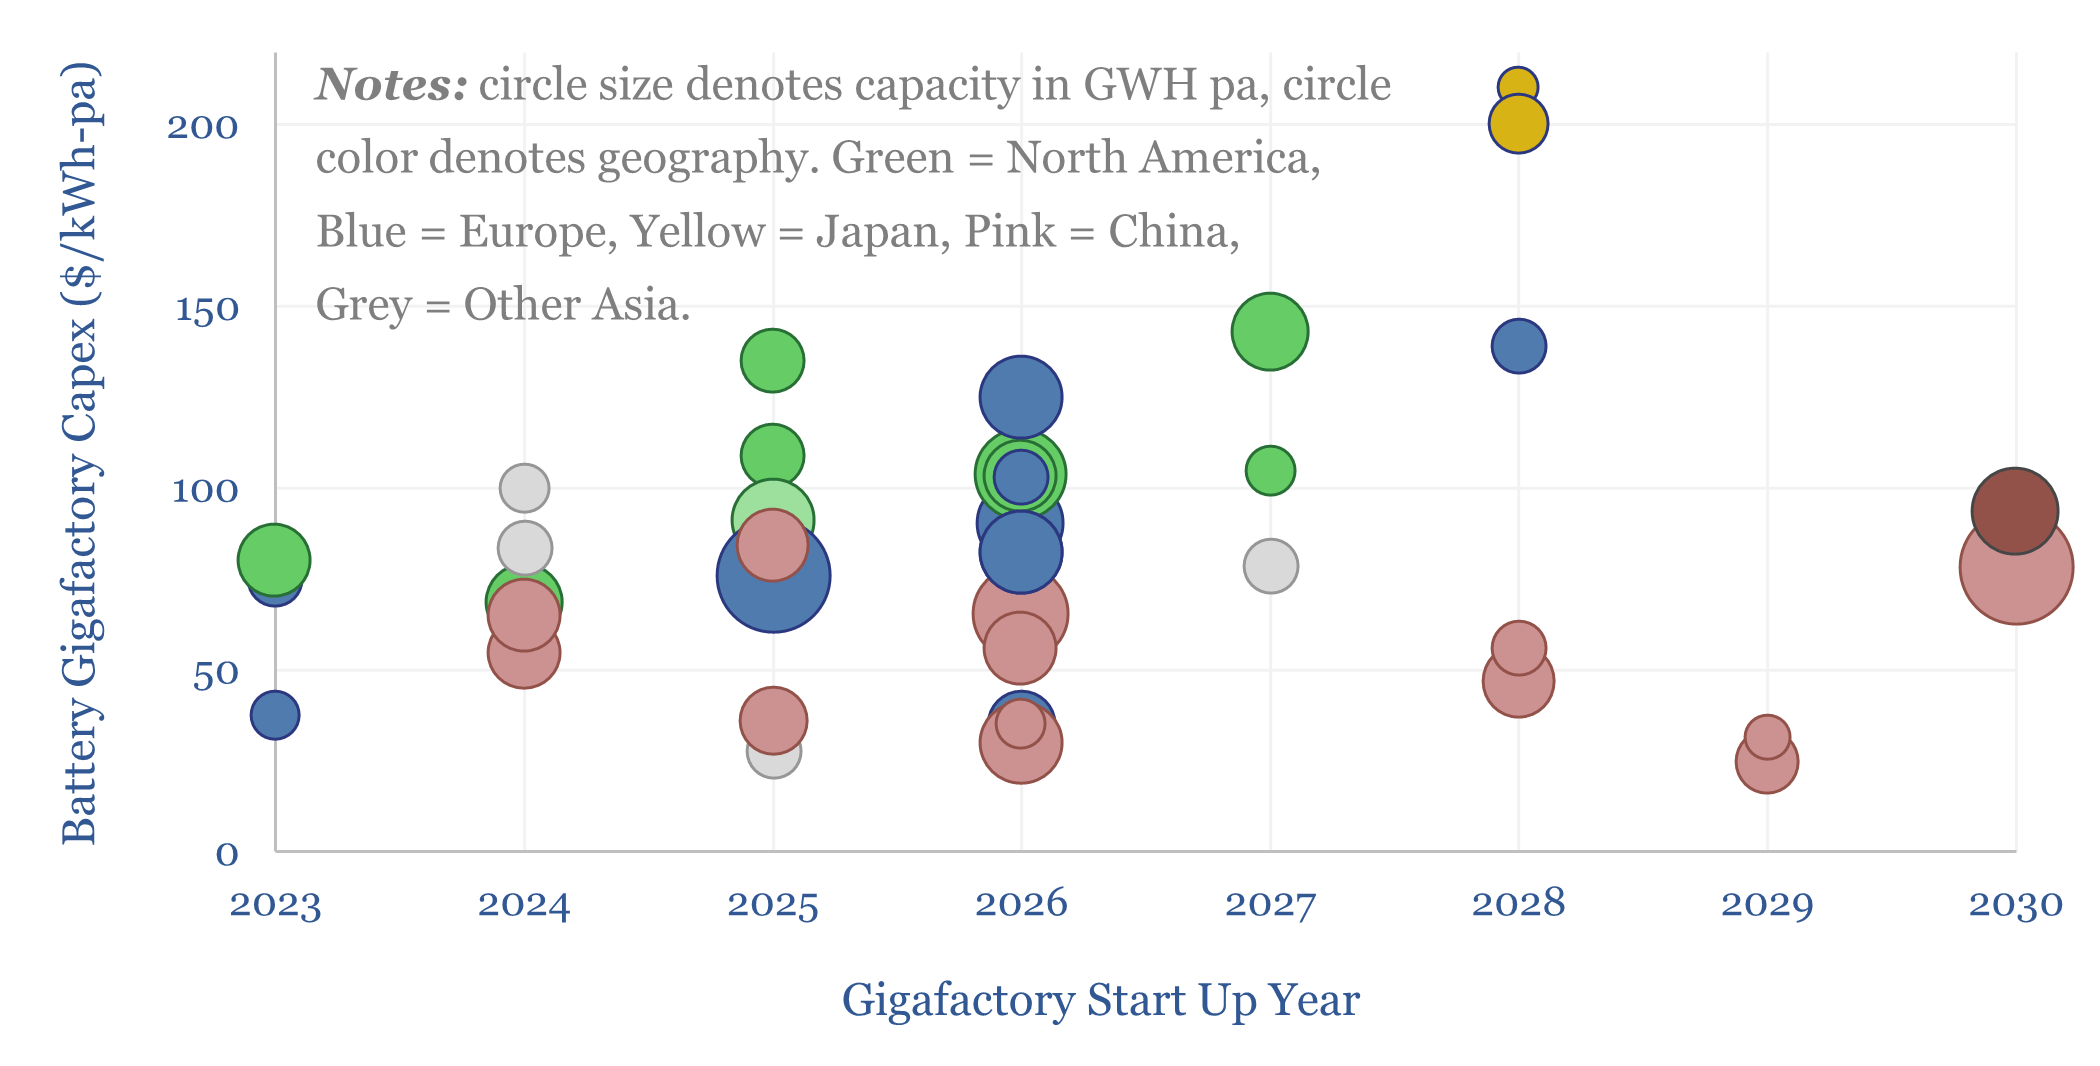
Battery gigafactory capex costs?

This data-file captures battery Gigafactory capex costs, by region, by chemistry, by company and over time, by looking across a sample of 40 major projects. Capex costs average $80/kWh-pa of capacity. Each GWH pa of capacity is associated with 70 full-time employees.
-
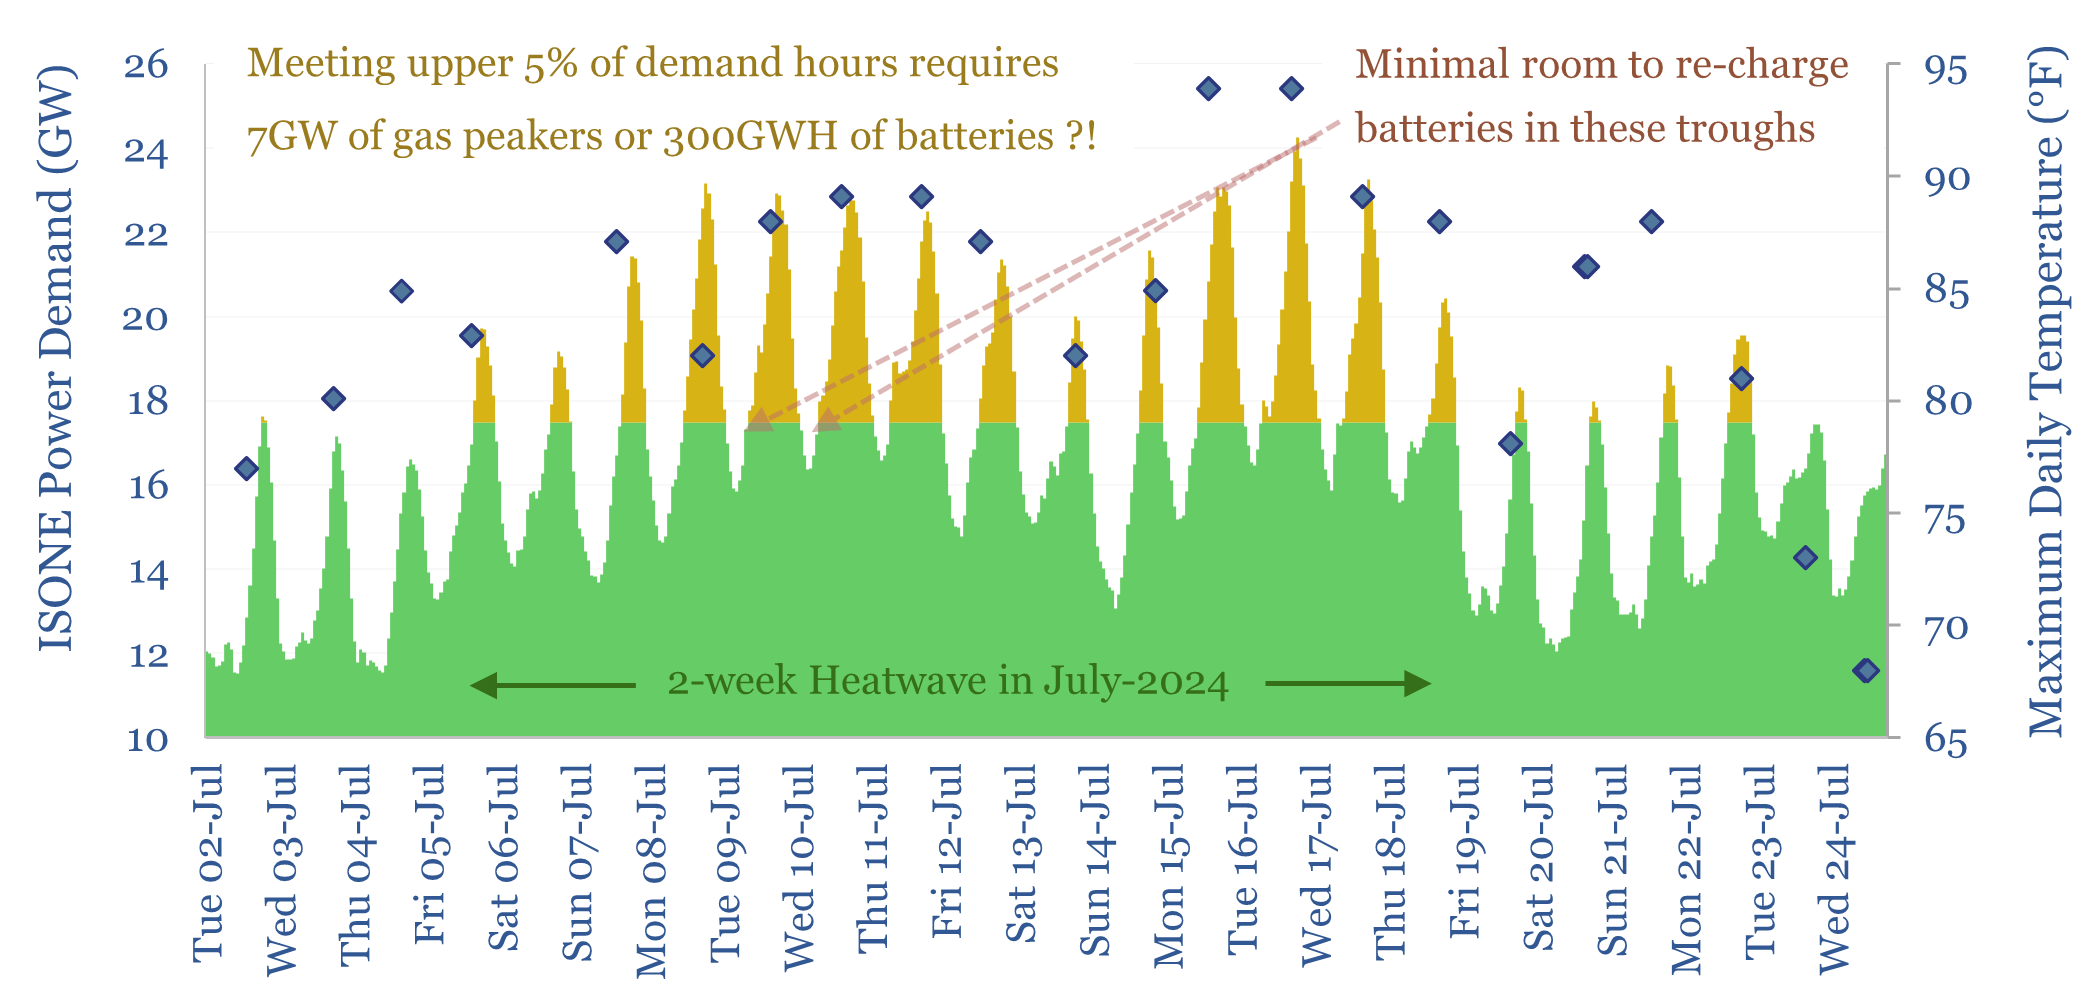
Peak loads: can batteries displace gas peakers?

Peak loads in power grids are caused by heatwaves (in the US) and cold snaps (in Europe), which last 2-14 days. This 16-page report finds that very large batteries would be needed to ride through these episodes, costing 2-20x more than gas peakers. But the outlook differs interestingly between the US vs Europe.
-
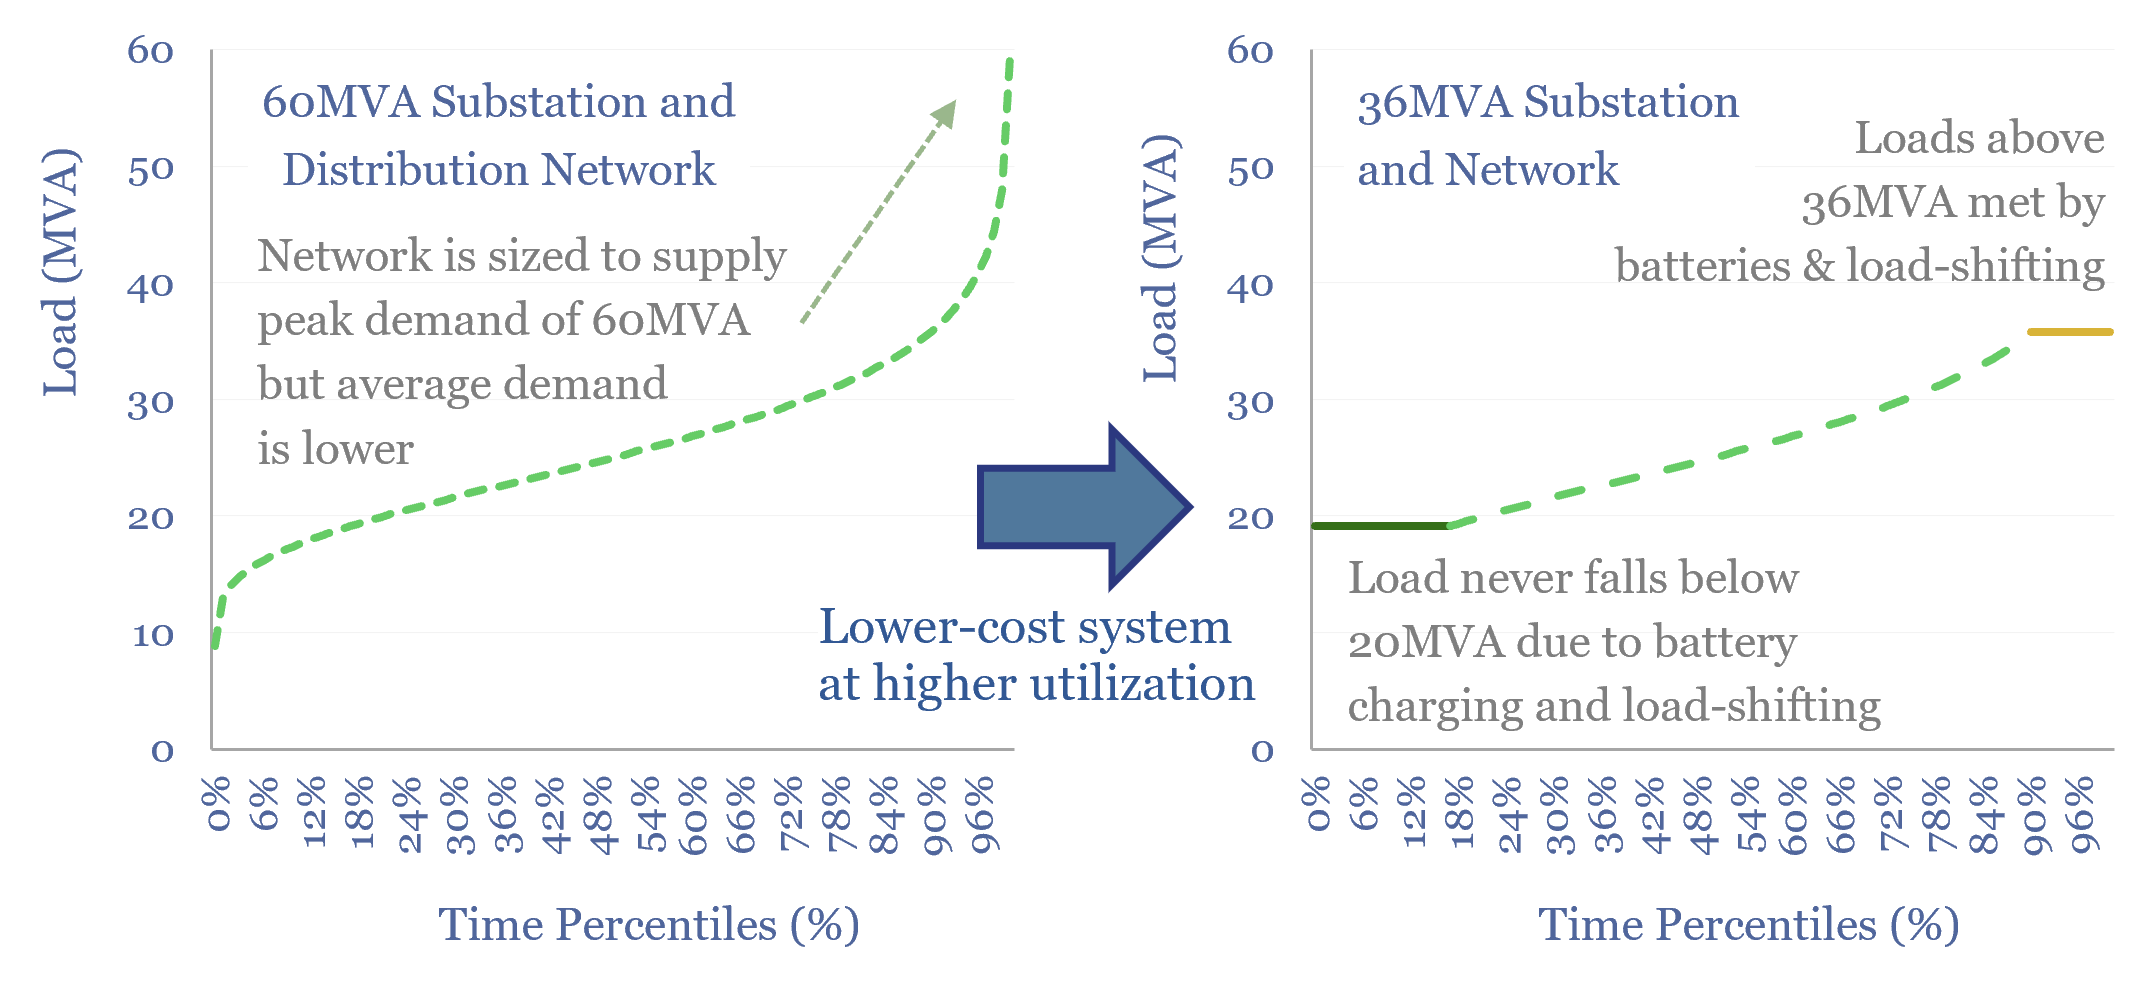
Power grid bottlenecks: flattening the curve?

Will persistent grid bottlenecks de-rail electricity growth? This 18-page report explores using batteries and smart energy systems to reduce the need for new power lines. This option can be surprisingly economical, when back-tested on real-world load profiles. Hence we are upgrading our battery outlook.
-
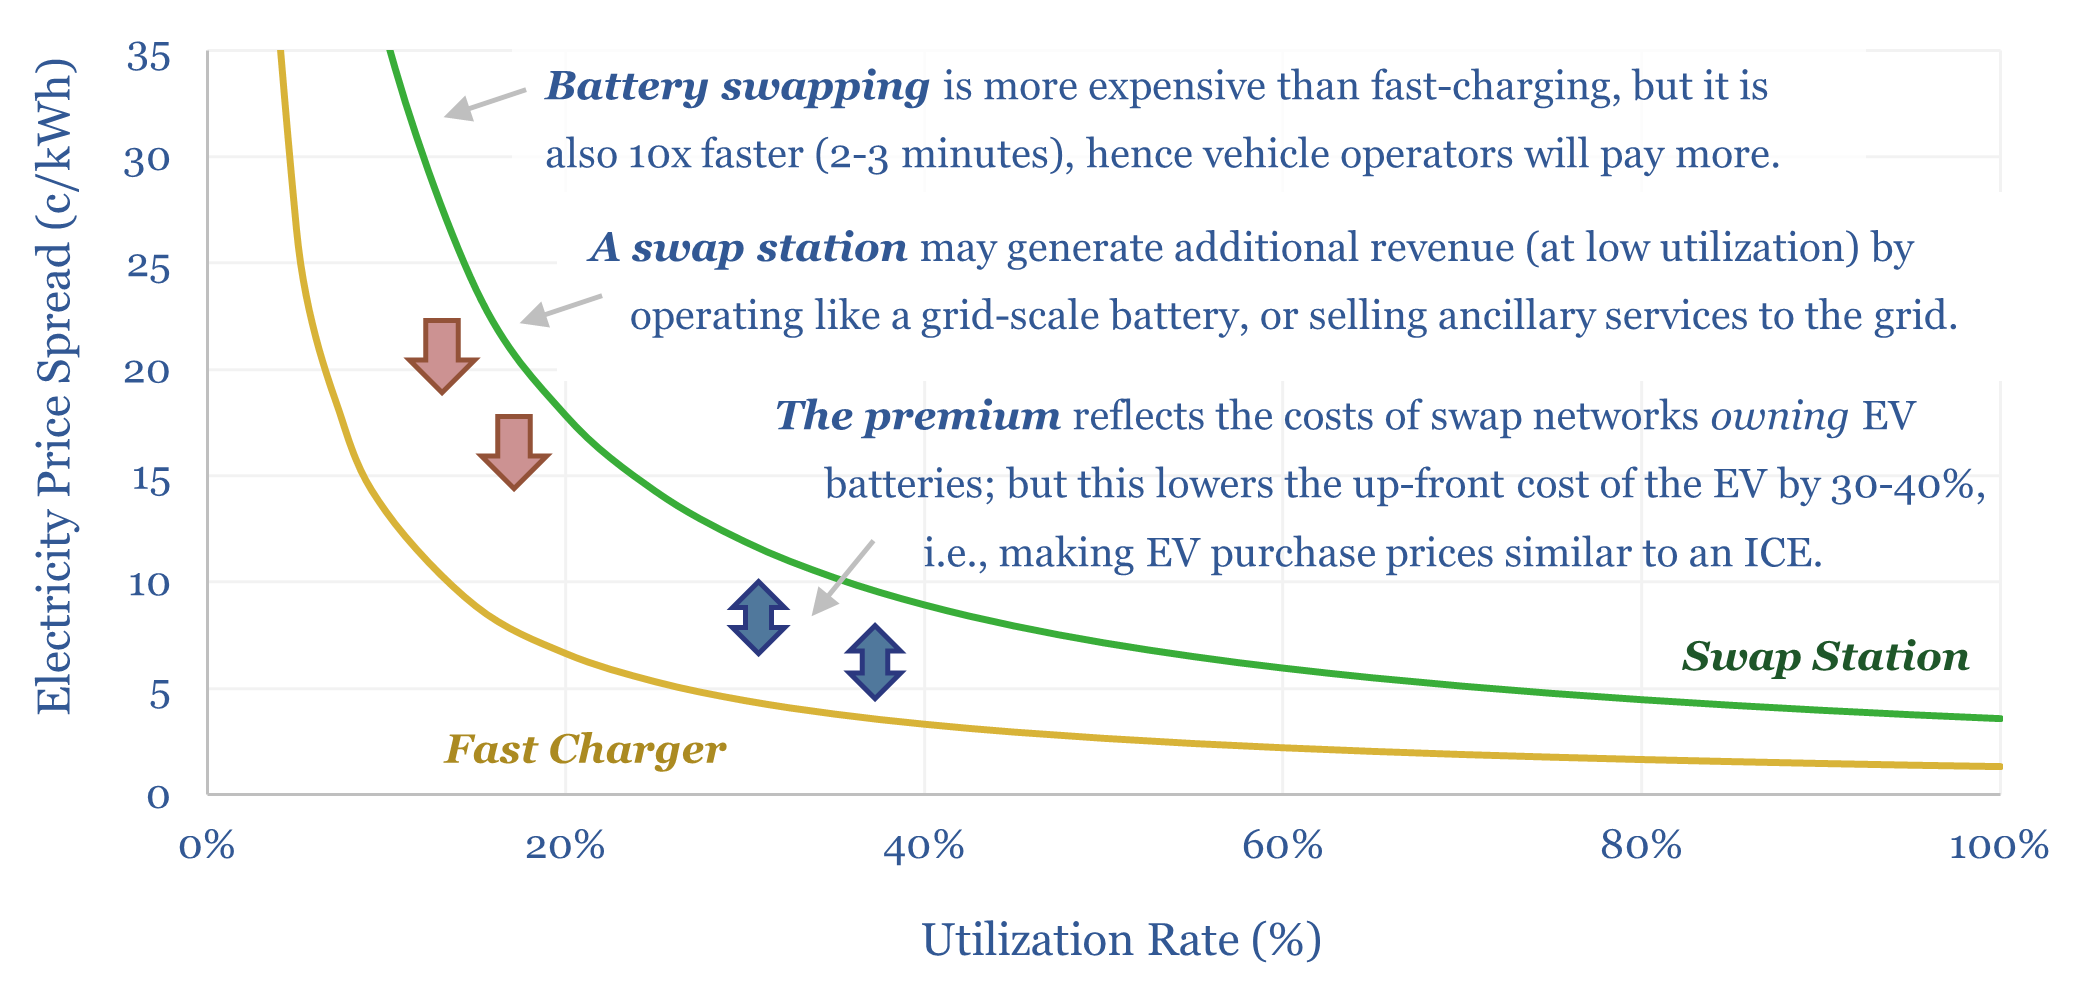
Battery swapping: off to the races?

Battery swapping has seen a sudden surge of interest, especially for cars in China, some heavy vehicles, and two-wheelers throughout emerging markets. Can the theme re-accelerate EVs? This 19-page report finds many advantages, controversies over costs, and profiles leading companies.
-
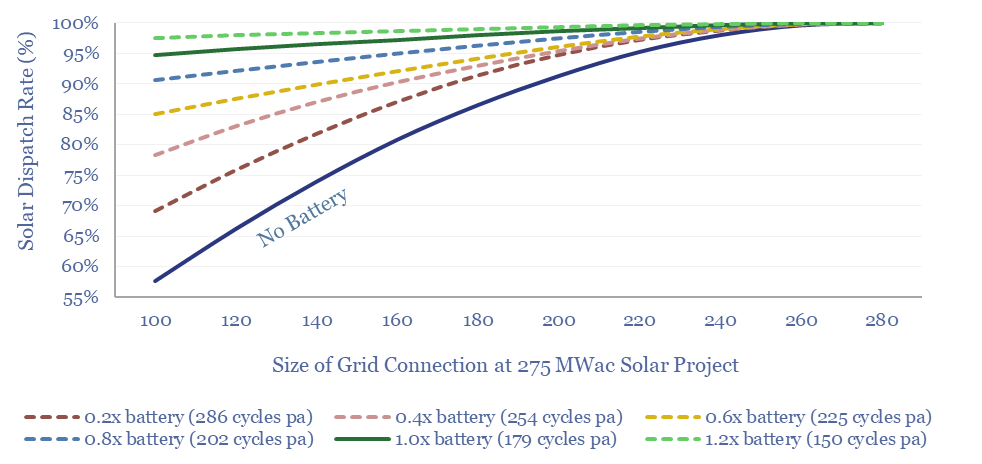
Solar plus batteries: the case for co-deployment?

This 9-page study finds unexpectedly strong support for co-deploying grid-scale batteries together with solar. The resultant output is stable, has synthetic inertia, is easier to interconnect in bottlenecked grids, and can be economically justified. What upside for grid-scale batteries?
-
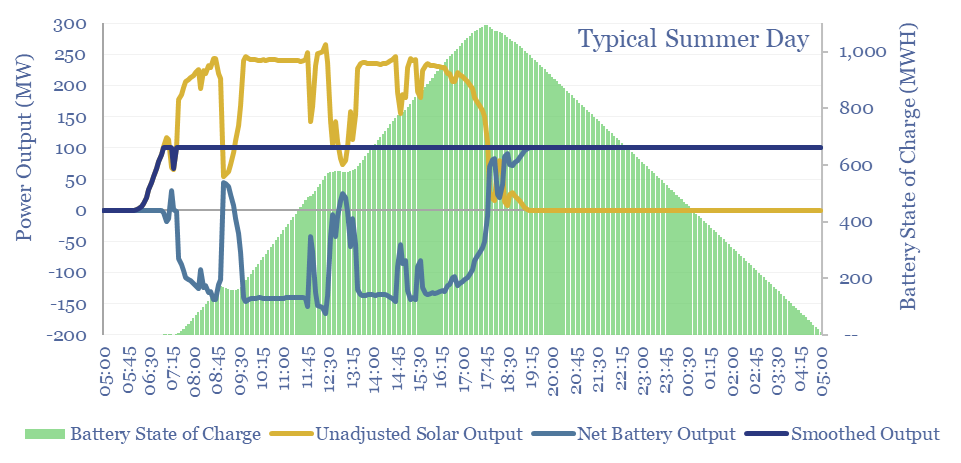
Solar+battery co-deployments: output profiles?

Solar+battery co-deployments allow a large and volatile solar asset to produce a moderate-sized and non-volatile power output, during 40-50% of all the hours throughout a calendar year. The smooth output is easier to integrate with power grids, including with a smaller grid connection. The battery will realistically cycle 100-300 times per year.
-
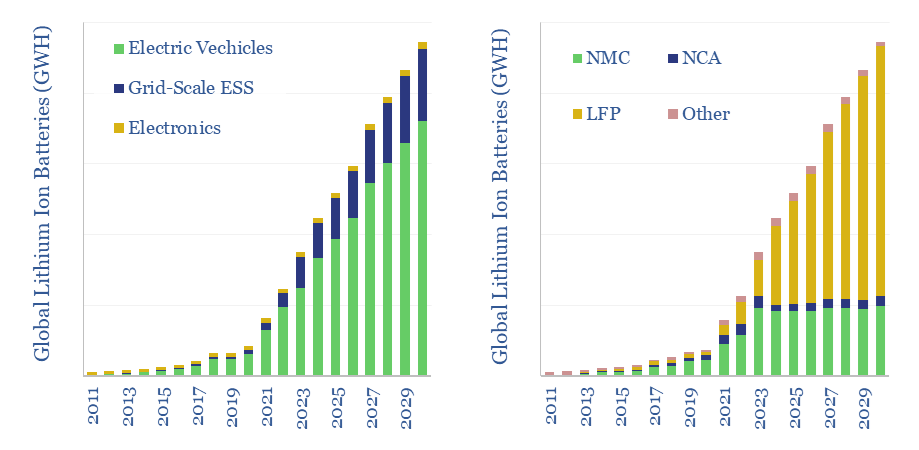
Lithium ion battery volumes by chemistry and use?

The lithium ion battery market reached 900GWH in 2023, representing 7x growth in the past half-decade since 2018, and 20x growth in the past decade since 2013. Volumes treble again by 2030. This data-file breaks down global ithium ion battery volumes by chemistry and be end use. A remarkable shift to LFP is underway, and…
-
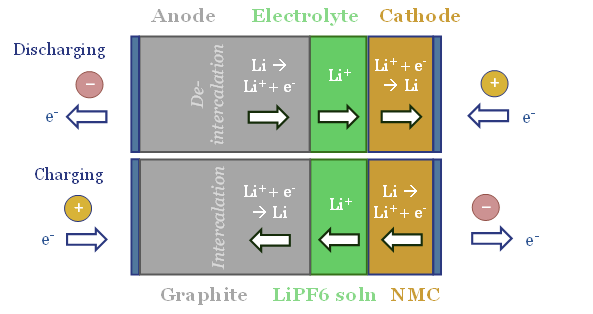
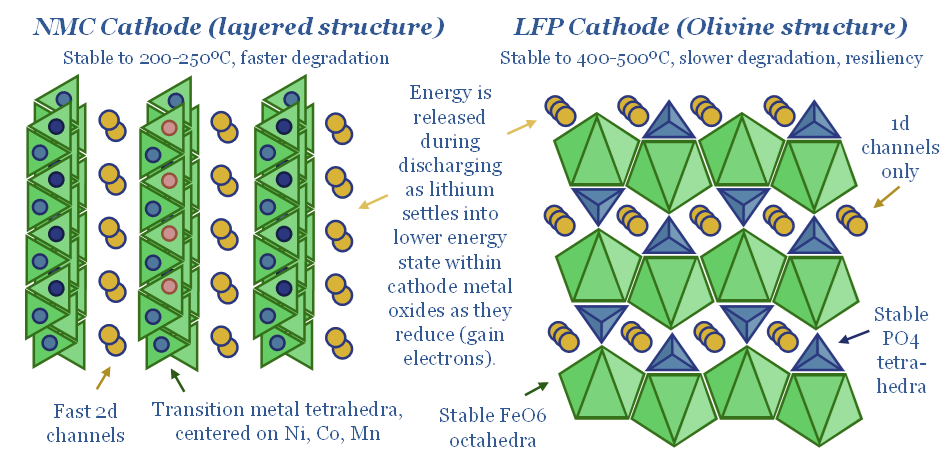
LFP batteries: cathode glow?

LFP batteries are fundamentally different from incumbent NMC cells: 2x more stable, 2x longer-lasting, $15/kWh cheaper reagents, $5/kWh cheaper manufacturing, and $25/kWh cheaper again when made in China. This 15-page report argues LFP will dominate future batteries, explores their costs, and draws implications for EVs and renewables.
Content by Category
- Batteries (89)
- Biofuels (44)
- Carbon Intensity (49)
- CCS (63)
- CO2 Removals (9)
- Coal (38)
- Company Diligence (95)
- Data Models (840)
- Decarbonization (160)
- Demand (110)
- Digital (60)
- Downstream (44)
- Economic Model (205)
- Energy Efficiency (75)
- Hydrogen (63)
- Industry Data (279)
- LNG (48)
- Materials (82)
- Metals (80)
- Midstream (43)
- Natural Gas (149)
- Nature (76)
- Nuclear (23)
- Oil (164)
- Patents (38)
- Plastics (44)
- Power Grids (130)
- Renewables (149)
- Screen (117)
- Semiconductors (32)
- Shale (51)
- Solar (68)
- Supply-Demand (45)
- Vehicles (90)
- Wind (44)
- Written Research (354)