-
Global CCS Projects Database

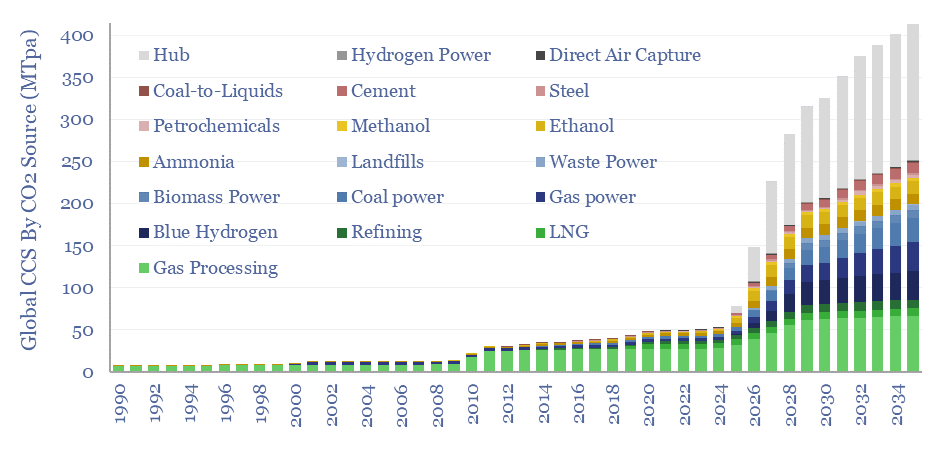
Over 400 CCS projects are tracked in our global CCS projects database. The average project is 2MTpa in size, with capex of $600/Tpa, underpinning over 400MTpa of risked global CCS by 2035, up 10x from 2019 levels. The largest CO2 sources are hubs, gas processing, blue hydrogen, gas power and coal power. The most active…
-
Water injection at oil fields: the economics?

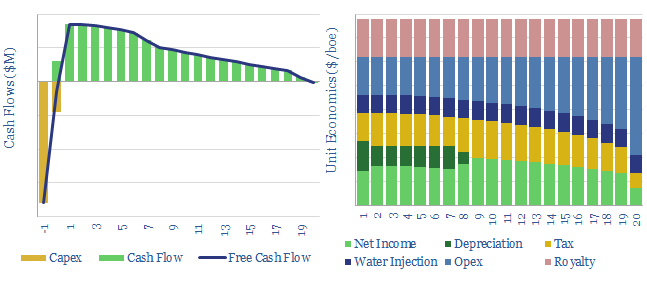
This model captures the economics of a conventional waterflood project, in order to maintain reservoir pressure at maturing oilfields. Our base case calculations suggest 30% IRRs at $40/bbl oil, on a project costing $2.5/boe in capex and $1/bbl of incremental opex costs.
-
Solar Use within the Oil Industry?

20 solar projects are being undertaken across the oil industry, to reduce CO2 emissions. But today’s project pipeline will obviate less than 1% of oil industry CO2 by 2025. So momentum must build behind these leading examples, which are: steam-EOR in Oman and California, Solar PV in the Permian, and specific companies such as Occidental,…
-
At the cutting edge of EOR?

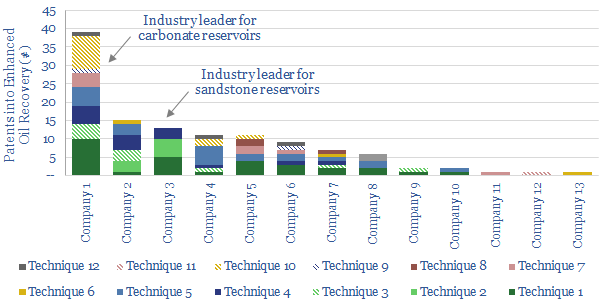
This data-file summarises 120 patents into Enhanced Oil Recovery, filed by the leading Oil Majors in 2018. Hence, we can identify clear leaders in EOR technology, and what they are doing at the cutting edge, to improve recovery and lower decline rates. As the world’s oilfields age, leading EOR technology will help avoid the higher…
-
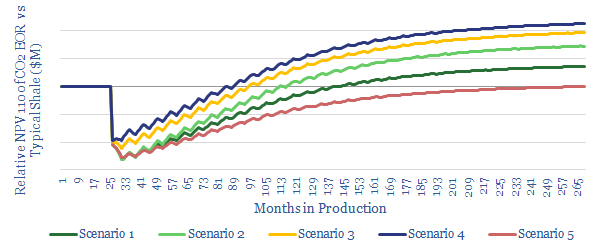
CO2-EOR in Shale: the economics

We model the economics for CO2-EOR in shales, after interest in this topic spiked 2.3x YoY in the 2019 technical literature. We see 15% IRRs in our base case, creating $1.6M of incremental value per well, uplifting type curves by 1.75x. Greater upside is readily possible. Most exciting is the prospect for Permian EOR to…
-
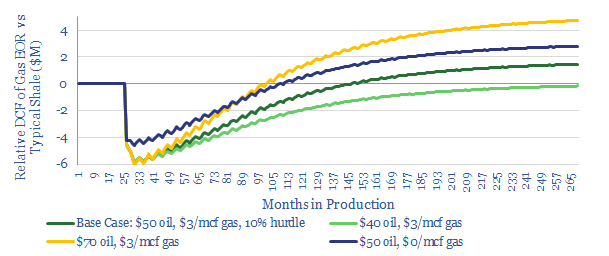
Shale EOR: the economics

This model assesses shale-EOR economics, as a function of oil prices, gas prices, production-profiles and capex costs. 15-20% IRRs are attainable in our base case. Economics are getting increasingly exciting, as the technology is de-risked and more gas is stranded in key shale basins.
Content by Category
- Batteries (87)
- Biofuels (42)
- Carbon Intensity (49)
- CCS (63)
- CO2 Removals (9)
- Coal (38)
- Company Diligence (90)
- Data Models (816)
- Decarbonization (159)
- Demand (108)
- Digital (56)
- Downstream (44)
- Economic Model (197)
- Energy Efficiency (75)
- Hydrogen (63)
- Industry Data (273)
- LNG (48)
- Materials (79)
- Metals (71)
- Midstream (43)
- Natural Gas (146)
- Nature (76)
- Nuclear (22)
- Oil (162)
- Patents (38)
- Plastics (44)
- Power Grids (123)
- Renewables (149)
- Screen (112)
- Semiconductors (30)
- Shale (51)
- Solar (67)
- Supply-Demand (45)
- Vehicles (90)
- Wind (43)
- Written Research (345)