-
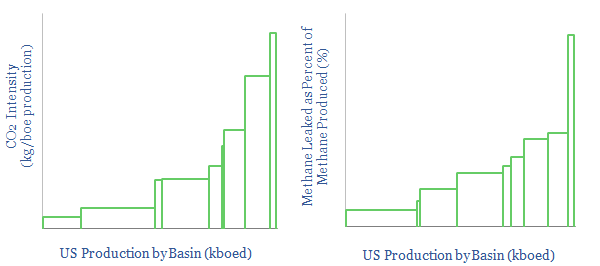
US CO2 and Methane Intensity by Basin

The CO2 intensity of oil and gas production is tabulated for 425 distinct company positions across 12 distinct US onshore basins in this data-file. Using the data, we can aggregate the total upstream CO2 intensity in (kg/boe), methane leakage rates (%) and flaring intensity (in mcf/boe), by company, by basin and across the US Lower 48.
-
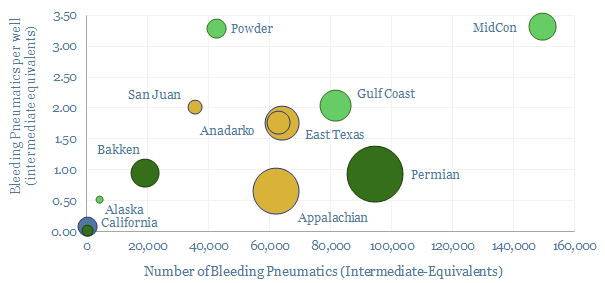
Methane emissions from pneumatic devices: by operator, by basin?

Methane leaks from 1M pneumatic devices across the US onshore oil and gas industry comprise 50% of all US upstream methane leaks and 20% of upstream CO2. This file aggregates the data. Rankings reveal operators with a pressing priority to replace >100,000 medium and high bleed devices, and other best-in-class companies.
-
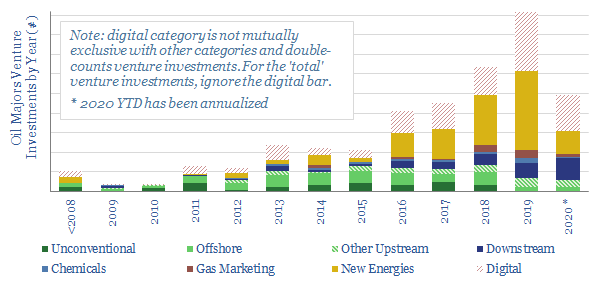
Ventures for an Energy Transition?

This database tabulates c300 venture investments, made by 9 of the leading Oil Majors. Their strategy is increasingly geared to advancing new energies, digital technologies and improving mobility. Different companies are compared and contrasted, including the full list of venture investments over time.
-
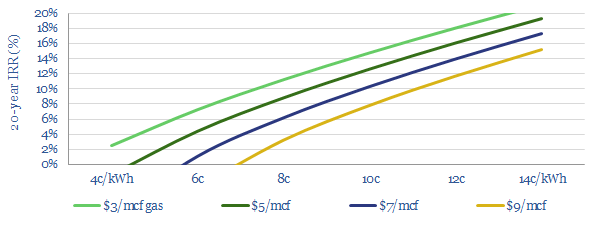
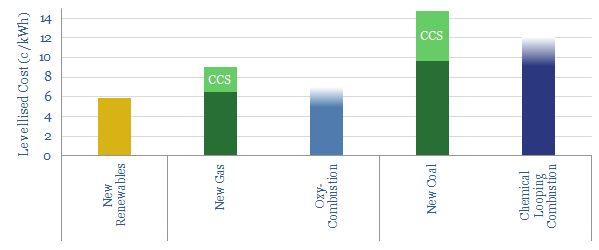
Oxycombustion: economics of zero-carbon gas?

Oxy-combustion is a next-generation power technology, burning fossil fuels in an inert atmosphere of CO2 and oxygen. It is easy to sequester CO2 from its exhaust gases, helping heat and power to decarbonise. We argue that IRRs can be competitive with conventional gas-fired power plants.
-
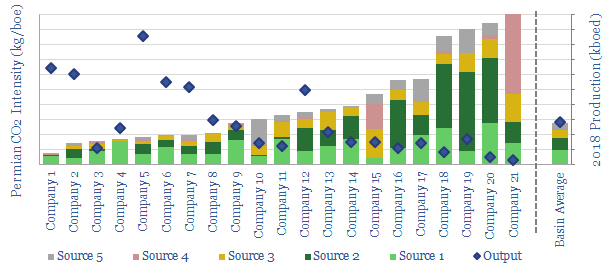
Permian CO2 Emissions by Producer

This data-file tabulates Permian CO2 intensity, based on regulatory disclosures from 20 of the leading producers to the EPA. The data are disaggregated by company, across 18 different categories, such as combustion, flaring, venting, pneumatics, storage tanks and methane leaks. There are opportunities to lower emissions.
-
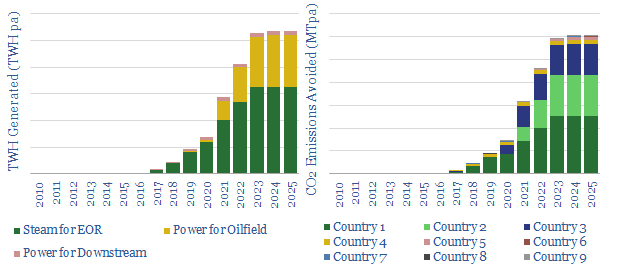
Solar Use within the Oil Industry?

20 solar projects are being undertaken across the oil industry, to reduce CO2 emissions. But today’s project pipeline will obviate less than 1% of oil industry CO2 by 2025. So momentum must build behind these leading examples, which are: steam-EOR in Oman and California, Solar PV in the Permian, and specific companies such as Occidental,…
-
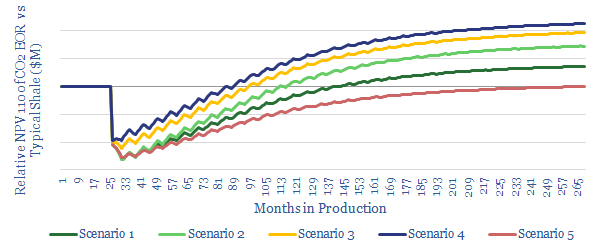
CO2-EOR in Shale: the economics

We model the economics for CO2-EOR in shales, after interest in this topic spiked 2.3x YoY in the 2019 technical literature. We see 15% IRRs in our base case, creating $1.6M of incremental value per well, uplifting type curves by 1.75x. Greater upside is readily possible. Most exciting is the prospect for Permian EOR to…
-
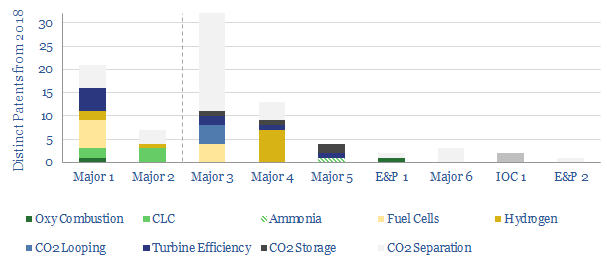
Major technologies to decarbonise power?

Oil Majors will play a crucial role in decarbonising the energy system, while also securing the future of fossil fuels. Hence, to help identify the leading companies, this-data file summarises over 80 patents for de-carbonising power-generation, drawn from our database of over 3,000 patent-filings from the largest energy companies in 2018.
-
De-carbonising carbon?

Decarbonisation is often taken to mean the end of fossil fuels. More feasible is to de-carbonise fossil fuels. This 15-page note explores two top opportunities for low-cost decarbonisation of coal and gas: ‘Oxy-Combustion’ and ‘Chemical Looping Combustion’. Leading Oil Majors support these solutions.
-
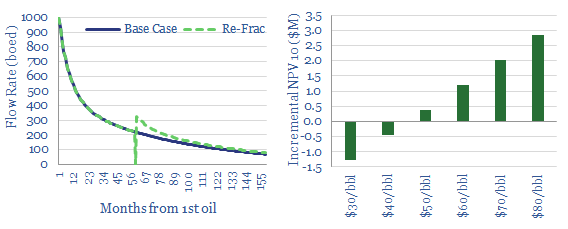
Re-Frac Economics. How much uplift?

Re-fracturing Permian and Eagle Ford shale wells holds potential at higher oil prices. Our base case assumes $0.5M NPV/well uplifts, and $45/bbl breakevens. Higher prices and process-enhancements can unlock $2-3M of NPV10/well. Oxy and Devon lead the technical literature.
Content by Category
- Batteries (89)
- Biofuels (44)
- Carbon Intensity (49)
- CCS (63)
- CO2 Removals (9)
- Coal (38)
- Company Diligence (95)
- Data Models (840)
- Decarbonization (160)
- Demand (110)
- Digital (60)
- Downstream (44)
- Economic Model (205)
- Energy Efficiency (75)
- Hydrogen (63)
- Industry Data (279)
- LNG (48)
- Materials (82)
- Metals (80)
- Midstream (43)
- Natural Gas (149)
- Nature (76)
- Nuclear (23)
- Oil (164)
- Patents (38)
- Plastics (44)
- Power Grids (130)
- Renewables (149)
- Screen (117)
- Semiconductors (32)
- Shale (51)
- Solar (68)
- Supply-Demand (45)
- Vehicles (90)
- Wind (44)
- Written Research (354)