-
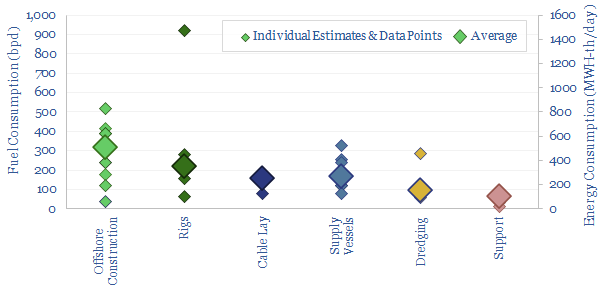
Offshore vessels: fuel consumption?

This database tabulates the typical fuel consumption of offshore vessels, in bpd and MWH/day. We think a typical offshore construction vessel will consume 300bpd, a typical rig consumes 200bpd, supply vessels consume 150bpd, cable-lay vessels consume 150bpd, dredging vessels consume 100bpd and medium-sized support vessels consume 50bpd. Examples are given in each category, with typical…
-
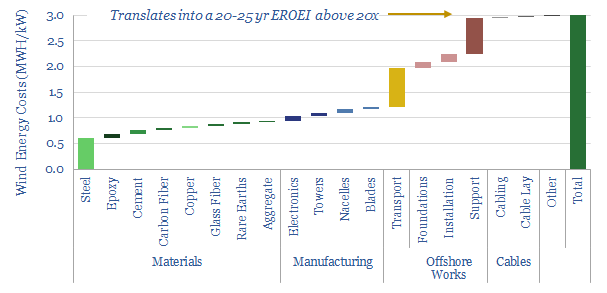
Wind power: energy costs, energy payback and EROEI?
This data-file estimates 3MWH of energy is consumed in manufacturing and installing 1kW of offshore wind turbines, the energy payback time is usually around 1-year, and total energy return on energy invested (EROEI) will be above 20x. These estimates are based on bottom-up modelling and top-down technical papers.
-
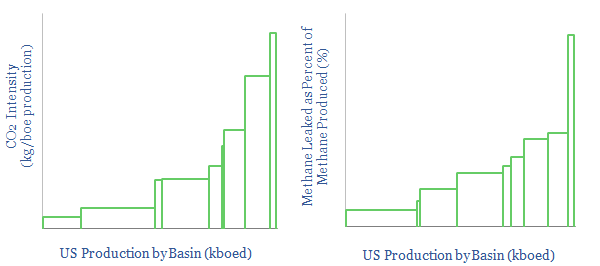
US CO2 and Methane Intensity by Basin

The CO2 intensity of oil and gas production is tabulated for 425 distinct company positions across 12 distinct US onshore basins in this data-file. Using the data, we can aggregate the total upstream CO2 intensity in (kg/boe), methane leakage rates (%) and flaring intensity (in mcf/boe), by company, by basin and across the US Lower 48.
-
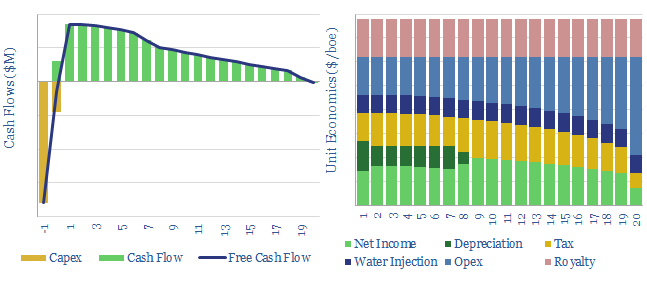
Water injection at oil fields: the economics?

This model captures the economics of a conventional waterflood project, in order to maintain reservoir pressure at maturing oilfields. Our base case calculations suggest 30% IRRs at $40/bbl oil, on a project costing $2.5/boe in capex and $1/bbl of incremental opex costs.
-
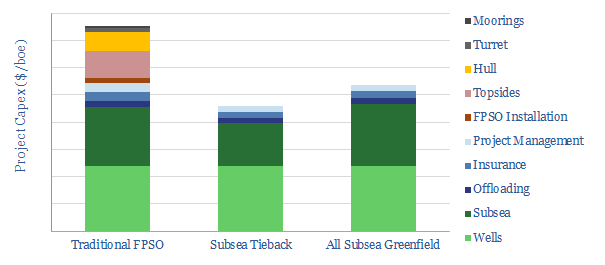
Floating production systems versus subsea tiebacks: the costs?

This model estimates the line-by-line costs of an FPSO project, across c45 distinct cost lines (in $M and $/boe). We estimate c$750M of cost savings for a tieback, and c$500M of cost savings for a fully subsea development, as compared against a traditional project with a traditional production facility.
-
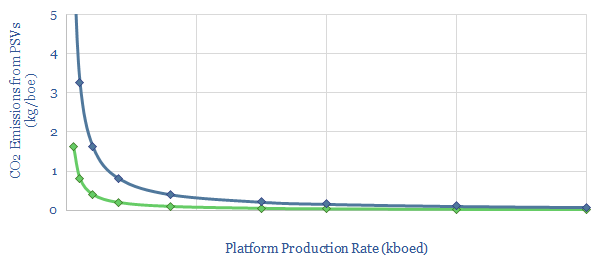
Platform supply vessels: what contribution to CO2?

This data-file calculates the contribution of Platform Supply Vessels (PSVs) to an oil and gas asset’s emissions. Our base case estimate is 0.1kg/boe for a productive asset in a well-developed basin. Numbers rise 4x in a remote basin, and by another c4x for smaller fields. 1kg/boe is possible. These emissions can be lowered by 10-20% through…
-
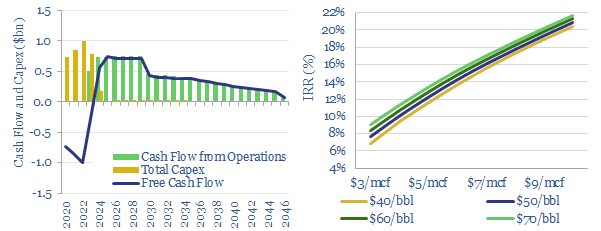
Fully subsea offshore projects: the economics?

The model presents the economic impacts of developing a typical, 625Mboe offshore gas condensate field using a fully subsea solution, compared against installing a new production facility. The result is a c4% uplift in IRRs, a 50% uplift in NPV6 and a 33% reduction in the project’s gas-breakeven price. The economics are attractive.
-
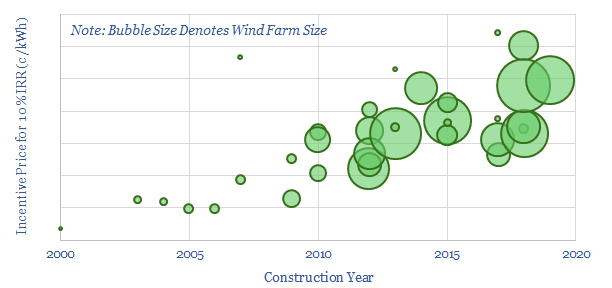
Offshore wind costs are inflating?

This data-file tabulates the capex costs of 35 offshore wind projects in the UK, with 8.5GW of capacity, which have been installed since the year 2000. There is little evidence for deflation. Rather, breakeven power prices appear to have risen at a 2.5% CAGR over the past decade. Our modelling is show in the data-file.
-
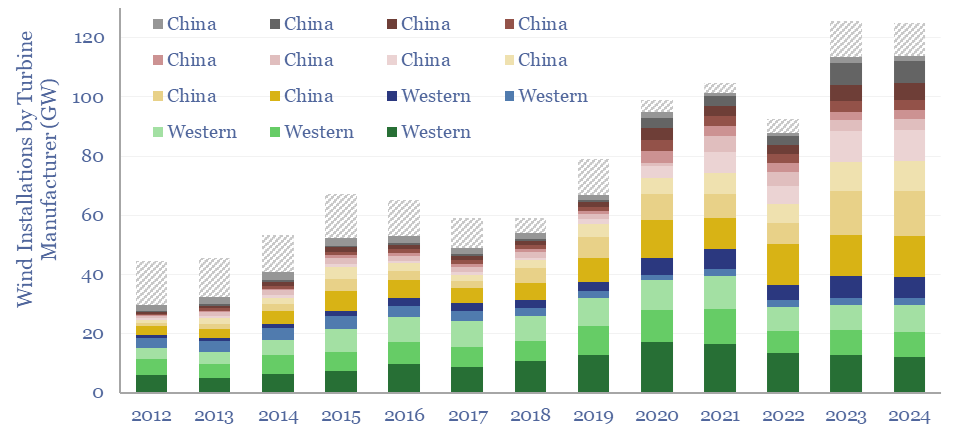
Wind turbine manufacturers: market share over time?

This data-file tracks wind turbine manufacturers, their market shares and their margins over time. By 2024, fifteen companies account for 95% of global wind turbine installations. This includes large Western incumbents, and a growing share for Chinese entrants, which now comprise over half of the total market, limiting sector-wide operating margins to c3%.
-
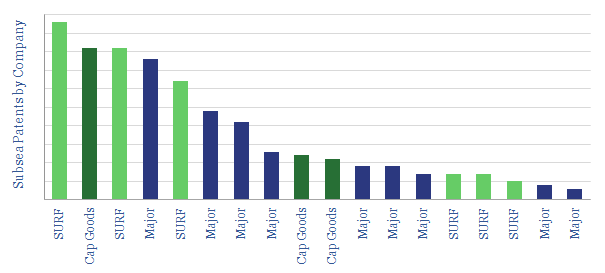
Subsea Services: Patent Leaders?

This data-file captures all the subsea patents from ten of the largest service providers. Priorities have shifted since the oil downturn. The data show who is most innovative and who is best placed, by category. Clear leadership is seen in subsea pumps, wellheads, or umbilicals. Other areas are more competitive.
Content by Category
- Batteries (89)
- Biofuels (44)
- Carbon Intensity (49)
- CCS (63)
- CO2 Removals (9)
- Coal (38)
- Company Diligence (95)
- Data Models (840)
- Decarbonization (160)
- Demand (110)
- Digital (60)
- Downstream (44)
- Economic Model (205)
- Energy Efficiency (75)
- Hydrogen (63)
- Industry Data (279)
- LNG (48)
- Materials (82)
- Metals (80)
- Midstream (43)
- Natural Gas (149)
- Nature (76)
- Nuclear (23)
- Oil (164)
- Patents (38)
- Plastics (44)
- Power Grids (131)
- Renewables (149)
- Screen (117)
- Semiconductors (32)
- Shale (51)
- Solar (68)
- Supply-Demand (45)
- Vehicles (90)
- Wind (44)
- Written Research (356)