Methane emissions from pneumatic devices: by operator, by basin?

Methane emissions from pneumatic devices across the US onshore oil and gas industry comprise 50% of all US upstream methane leaks and 15% of all upstream CO2. This data-file aggregates data on 800,000 pneumatic devices, from 300 acreage positions, of 200 onshore producers, in 12 US basins.


Pneumatic devices are valves and pumps that are actuated by pressurized natural gas, widely used in the oil and gas industry, and numbering around 800,000 in the US in 2021, across 22Mboed of production that we are tracking, acreage position by acreage position, based on EPA disclosures.

The problem with pneumatic devices is that they leak methane, a greenhouse gas, emitting an average of 1 ton of methane per device per year, explaining 20MTpa of US CO2e emissions, equivalent to 2.5 kg/boe of Scope 1 CO2 emissions, or around half of the CO2 attributed to methane leaks in the US upstream oil and gas industry.

So over time, we expect bleeding pneumatic devices to be phased out in the US, especially ‘high bleed’ pneumatic devices, which emit around 5 tons of methane per device per year, as part of the industry’s growing efforts to mitigate methane. (This note also covers companies in the supply chain to help mitigate methane emissions from pneumatic devices, including a switch to electrically actuated devices, example here).

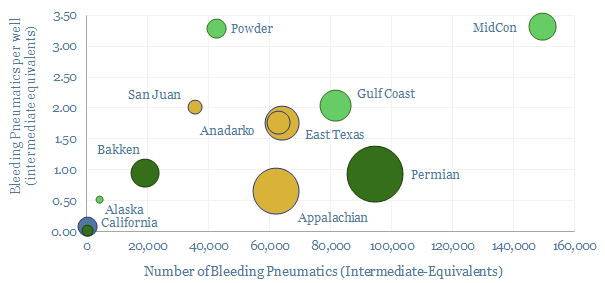
We have been tracking methane emissions from pneumatic devices in the US oilfield since 2018, although the latest data from 2021 do not show much improvement in aggregate (chart above).

The average well that is in operation in the US oilfield is associated with 1.4 bleeding pneumatic devices, although it is highest in basins that produce similar quantities of both oil and gas, at 2-3 pneumatic devices per well in the MidCon, Anadarko basin and Eagle Ford, while it is lowest in the Marcellus and Utica, at 0.75 pneumatic devices per well, as pure-play gas producers primarily aim to monetize not leak their gas.

Methodology. Note that in the chart above we have adjusted the data into ‘intermediate equivalents’. For example, the average low-bleed pneumatic device emits 9x less methane than the average intermediate-bleed device, and so we consider 9 low-bleed devices “equivalent” to one intermediate bleed device.

Pneumatic devices per well also vary vastly by operator. The best operators have well below 0.5 pneumatic devices per well, while some have shifted almost entirely to electrically actuated devices that use no methane.

Leaders include Pioneer, EOG, Diamondback, with no high-bleed pneumatic devices, and very few intermediate-bleed pneumatic devices across their portfolios.

On the other side of the spectrum are operators with 2-7 bleeding pneumatic devices per well. We have wondered in the past whether regulations are going to tighten and clamp down upon bleeding pneumatic devices, especially high bleed pneumatic devices, and create large capex burdens on companies with methane-leaking assets.

In one case, it is surprising to us that a well-known E&P company, advertising itself as one of the ‘greenest’ operators in the US still has over 1,000 high-bleed pneumatic devices across its asset base, or over 10% of all the high-bleed pneumatic devices in the US.

Underlying data into the CO2 intensity of US oil and gas producers is aggregated by basin, by producer and by acreage position here. Another large source of methane leaks is flaring, covered in our note here.

Enhanced geothermal: technology challenges?

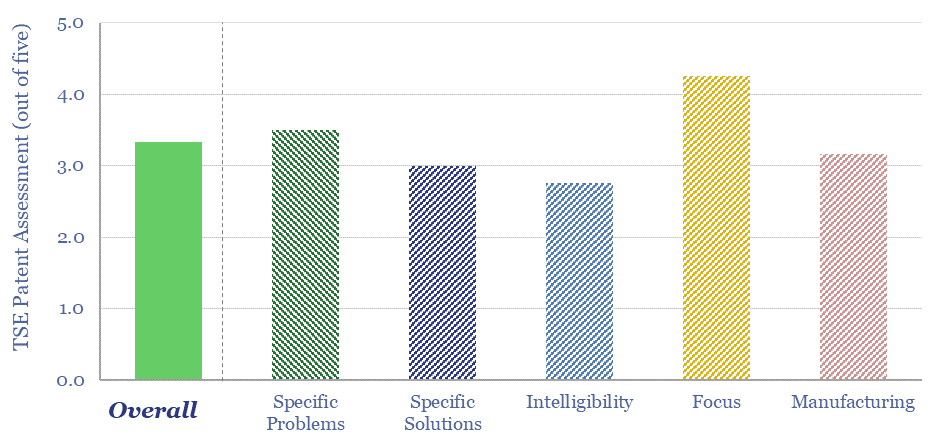
Thunder Said Energy's patent review scores (on a five-point scale) for Eavor's enhanced geothermal technology. Scores higher on focus, but lower on intelligibility.

This data-file tabulates the greatest challenges and focus areas for harnessing enhanced geothermal energy, aka deep geothermal technology, based on reviewing patents from 20 companies in the space. In particular, we have focused in upon Eavor Technologies, which has a clear moat around its drilling, sealing and working fluid technologies.


Enhanced geothermal energy projects aim to access 50-300ยบC temperatures in the sub-surface by drilling down to 2,000-6,000m total vertical depths. Our recent research has covered the emerging opportunities in enhanced geothermal.

But what are the key challenges for enhanced geothermal technologies? To answer this question, we have reviewed the challenges that are cited in recent patents (chart below).

Challenges for commercializing enhanced geothermal technologies identified during or patent review. The greatest remaining challenges are related to heat transfer and well design.

The patents confirm that the largest challenges for deep geothermal are drilling long multi-lateral wells, which contact sufficient reservoir volumes to transfer heat from the subsurface into the working fluids, without depleting the geothermal resource.

Recent advances from the unconventional oil and gas industry are likely to be a crucial enabler from deep geothermal, based on the comments made in the patents.

Eavor Technologies is the company that stood out most in our overview of the geothermal industry. Eavor Technologies is a private company founded in 2017, headquartered in Calgary, Alberta, employing c100 people, in order to develop a next-generation, closed-loop geothermal energy technology.

Eavor’s aspiration is that its geothermal systems can be deployed anywhere, to harness the Earth’s geothermal gradient, and provide clean, reliable, flexible baseload heat and power, without geological/exploration risk. The closed loop system does not use hydraulic fracturing, does not exchange fluids with the formation, and thus does not suffer a risk of causing water contamination or Earthquakes. Hence we have reviewed 20 patent families from Eavor.

Based on reviewing its patents, we conclude that Eavor has developed proprietary technologies to drill deep wells, into hot formations, seal them using silicates/aluminosilicates, and keep them sealed via additives in the working fluid. Specific chemical additives are clear from the patents. The full details are in the Eavor-Conclusions and Eavor-Patents tabs.

The remaining risks for enhanced geothermal technology are also discussed, based on the evidence in the patents.

Shale productivity: snakes and ladders?

Shale Productivity Snakes and Ladders

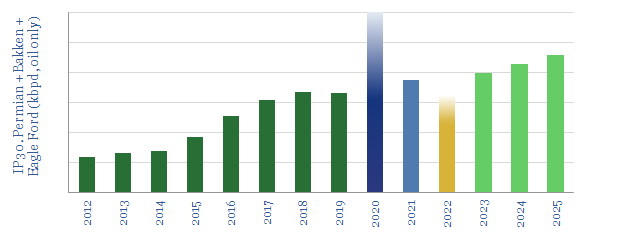
Unprecedented high-grading is now occurring in the US shale industry, amidst challenging industry conditions. This means 2020-21 production surprising to the upside, and we raise our forecasts +0.7 and +0.9Mbpd respectively. Conversely, when shale activity recovers, productivity could disappoint, and we lower our 2022+ forecasts by 0.2-0.9 Mbpd. This 7-page note explores the causes and consequences of this whipsaw effect.

Chevron: SuperMajor Shale in 2020?

Chevron Shale Technologies

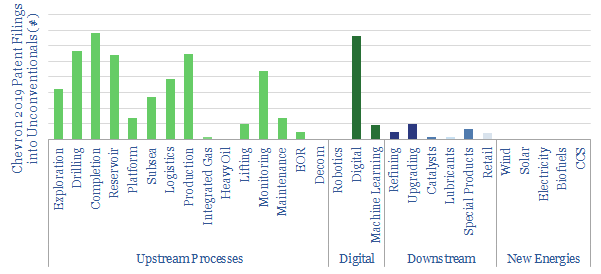
SuperMajorsโ€™ shale developments are assumed to differ from E&Psโ€™ mainly in their scale and access to capital. Access to superior technologies is rarely discussed. But new evidence is emerging. This note assesses 40 of Chevronโ€™s shale patents from 2019, showing a vast array of data-driven technologies, to optimize every aspect of shale.

Screen of companies detecting methane leaks?

Screen of companies detecting methane leaks

This data-file is a screen of companies detecting methane leaks and manufacturing equipment to minimize methane leaks. Mitigating methane is an important theme to ensure low carbon intensity as natural gas scales up and displaces coal in the energy transition. So how is this done? And which companies are enabling progress?


Methods available to monitor for methane emissions include Method 21, Optical Gas Imaging, Laser Based Imaging, Fixed Sensors, Ground Labs, Aircraft Flyovers, Drone Surveys and Satellite imagery. Technical data are presented on these different topics in the data-file, for example, on spatial resolution, costs and success rates of some of these different options. Some examples are below.

Different methods for sensing methane emissions and leaks by their measurement ranges, sensitivities, and time/cost.

But the main purpose of the file is to aggregate details, into a screen of companies detecting methane leaks and manufacturing equipment to minimize methane leaks.

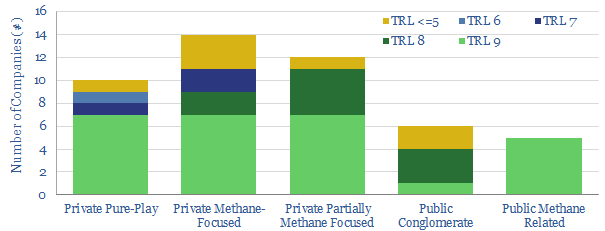
Looking across the screen, 50 companies are noted in the data-file. Around one-third are public, and two-thirds are private. Around two-thirds are deploying technically ready solutions today, while others are in the trial phase. 

More detailed case studies are also provided in the data-file. For example, we include a case study of Qube, which is an exciting company in advanced sensors, alongside peers such as Soofie and Earthview. Likewise, we included a case study of QLM, which is an exciting company in laser imaging, alongside peers such as Longpath and Mirico.

Operators are also screened, across the dozen largest Energy Majors, to estimate their methane leaks and broader methane intensity across the supply chain.

We have been adding to this screen continuously since 2019. Our sense is that the space is evolving very quickly. For example, in 2021-22, the EPA proposed new regulation, requiring operators to survey for methane leaks, bi-monthly, at 10kg/hr resolution, then to follow up with more sensitive methods to remediate any diagnosed leaks. Many of the companies that are now at commercial stages were founded in the 2015-20 timeframe. This suggests that as we continue updating the screen, more and more companies will be emerging.

In 2024, we screened a further dozen companies that are active in pressure sensing, which helps to improve oversight of the downstream gas distribution network. Sensing turns out to be a fascinating, $200bn pa industry, which is also crucial for greater digitization of industrial processes, benefitting from AI optimization, power grids and electric vehicle value chains.

Our note into mitigating methane in the energy transition remains a useful reference for the importance of this theme, and our key conclusions.

CO2 Intensity of Drilling Oil Wells?

CO2 Intensity of Drilling Oil Wells

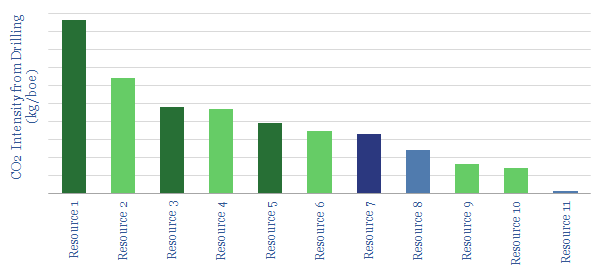
This data-file estimates the CO2 intensity of drilling oil wells, in our usual units of kg/boe. The calculations are conducted bottom-up, based on fuel consumption at onshore, offshore and deep-water rigs; plus drilling days and typical resource volumes per well.

Drilling wells is not the largest portion of the oil industry’s total CO2 intensity. Nevertheless there is a 50x spread between the best and worst barrels, which is wider than other categories we have screened.

Prolific fields will have the lowest drilling-CO2 intensities, particularly where they are onshore (e.g., Saudi Arabia). Infill wells at mature deepwater fields may have the highest drilling-CO2.

Development Concepts: how much CO2?

CO2 intensity of steel and concrete

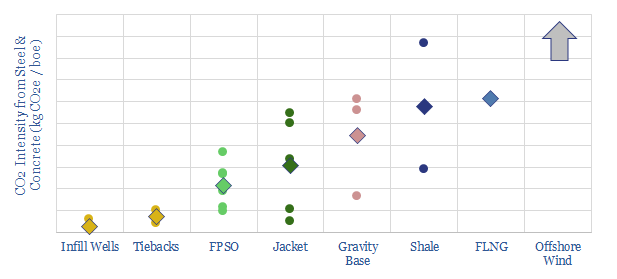
This data-file quantifies the costs and CO2 emissions associated with different oilfield development concepts’ construction materials.

We have tabulated c25 projects, breaking down the total tonnage of steel and concrete used in their topsides, jackets, hulls, wells, SURF and pipelines.  Included are the world’s largest FPSOs, platforms and floating structures; as well as new resources in shale, deepwater-GoM, Guyana, pre-salt Brazil and offshore Norway.

Infill wells, tiebacks and FPSOs make the most efficient use of construction materials per barrel of production. Fixed leg platforms are higher, then gravity based structures, then FLNG, and finally offshore wind (by a factor of 30x).


The cutting edge of shale technology?

shale technology technical papers

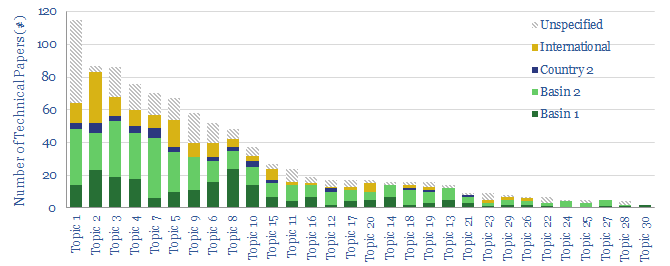
The database evaluates 950 technical papers that have been presented at shale industry conferences from 2018-2020.ย  We have summarised each paper, categorized it by topic, by author, by basin, ‘how digital’ and ‘how economically impactful’ it is.

The aim is to provide an overview of shale R&D, including the cutting edge to improve future resource productivity. We estimate 2020 was the most productivity-enhancing set of technical papers of any year in the database.

Recent areas of innovation include completion design, fracturing fluids, EORand machine learning. We also break down the technical papers, company-by-company, to see which operators and service firms have an edge (chart below).

Shale: Upgrade to Fiber?

DAS Quest for Idealized Completion

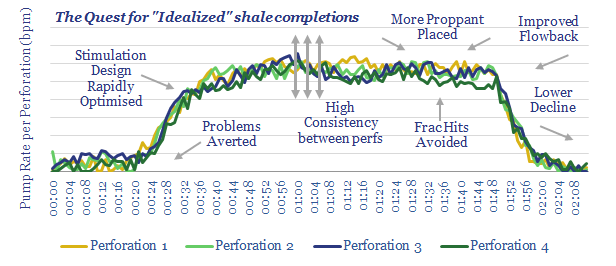
Completing a shale well depends on over 40 variables. Each one can be optimised using data. It follows that next-generation data could deliver next-generation shale productivity.

This note focuses on the most exciting new data methodology we have seen across the entire shale space: distributed acoustic sensing (DAS) using fiber-optic cables. It has now reached critical mass.

DAS will have six transformational effects on the shale industry. Leading operators and service companies are also assessed.

Leading Companies in DAS?

leading companies in DAS

This data-file quantifies the leading companies in Distributed Acoustic Sensing (DAS), the game-changing technology for enhancing shale and conventional oil industry productivity.

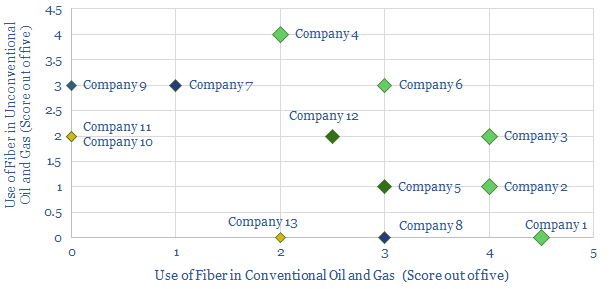
For operators (chart above), our rankings are based on assessing patents, technical papers and discussions with industry-participants.

For Services (chart below), our work summarises the companies, the ownership (e.g., public vs private), their offerings, their size and the technical papers they have filed.

Copyright: Thunder Said Energy, 2019-2025.