-
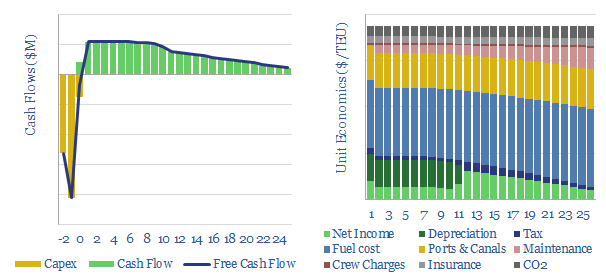
Container freight: shipping economics?

This data-file models the total costs of shipping a container c10,000 nautical miles from China to the West, in a 20,000 TEU vessel. Emerging fuels can lower the CO2 intensity of shipping from their baseline of 0.15kg/TEU-mile, by 60-90%, but freight costs inflate by 30%-3x.
-
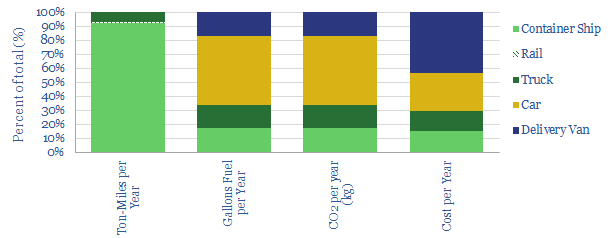
Distribution Costs: Ships, Trucks, Trains and Delivery Vans?

Distributing goods to the typical US consumer costs 1.5bbls of fuel, 600kg of CO2 and $1,000 per annum. The costs will increase 20-40% in the next decade, as the share of online retail doubles to c20%, hence new technologies are needed in last-mile delivery. This data-file provides a full breakdown of the numbers, across container-ships,…
-
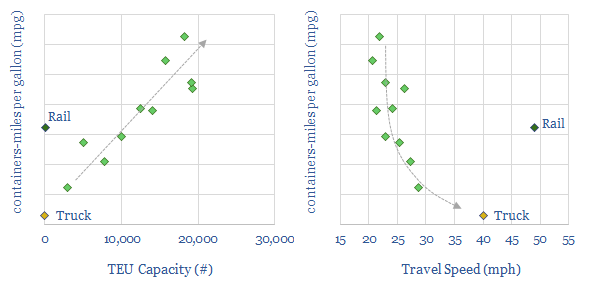
Container ships versus trucks and trains

This data-file tabulates the impressive fuel economy of container vessels, as a function of their size and speed. The best examples are 2x more efficient than typical trains and 20x more efficient than typical trucks. Hence, even as the OECD consumes 4kg per person per day of goods shipped from overseas, these container ships account for c0.25%…
-
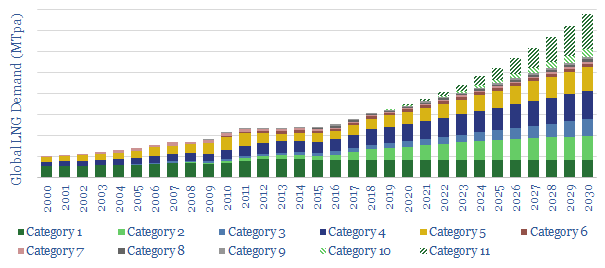
Long-Term LNG Demand: technology-led?

This is a simple model of long-term LNG demand, extrapolating out sensible estimates for the world’s leading LNG-consumers. On top of this, we overlay the upside from two nascent technology areas, which could add 200MTpa of potential upside to the market. Backup workings are included.
-
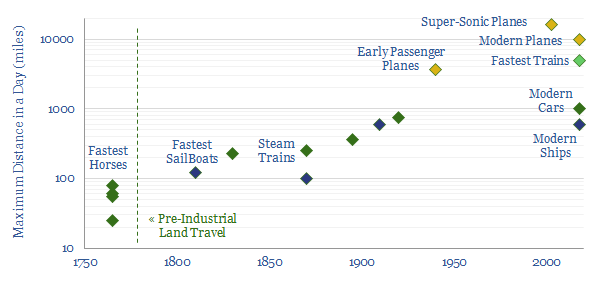
A Short History of Travel Speeds

Top travel speeds have increased c100x since pre-industrial times, however in the past 20-years, the trend has reversed. Average mobility is down c6-7% since 2000. This data-file contains our notes and the data-points we have compiled on travel-times throughout history.
-
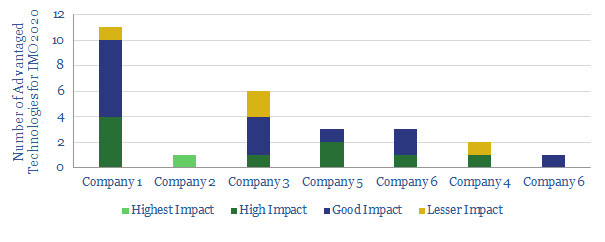
Our Top Technologies for IMO 2020

We review the top, proprietary technologies that we have seen from analysing patents and technical papers, to capitalise on IMO 2020 sulphur regulation, across the world’s leading integrated oil companies.
-
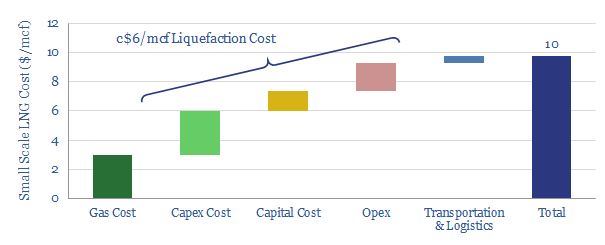
Small-Scale LNG liquefaction Costs: New Opportunities?

Small-scale LNG technologies can be economic at $10/mcf, generating 15% pre-tax IRRs, off $3/mcf input gas. This data-file tabulates the line-by-line costs of typical small-scale LNG technologies (SMRs, N2 expansion). Against this baseline, we model a more cutting-edge technology, which preserves strong economics at c25x smaller scale.
-
LNG in transport: scaling up by scaling down?
Next-generation technology in small-scale LNG has potential to reshape the global shipping-fuels industry. Especially after IMO 2020 sulphur regulations, LNG should compete with diesel. This note outlines the technologies, economics and opportunities for LNG as a transport fuel.
-
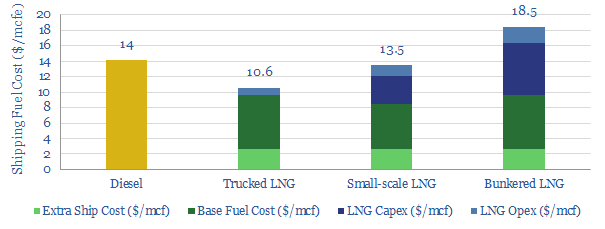
LNG as a Shipping Fuel: the Economics

This data-file provides line-by-line cost estimates for LNG as a shipping fuel, for trucked LNG, small-scale LNG and bunkered LNG. After IMO 2020 regulations buoy diesel pricing, it should be economical to fuel newbuild ships with small-scale LNG; and in the US it should be economical to convert pre-existing ships to LNG.
-
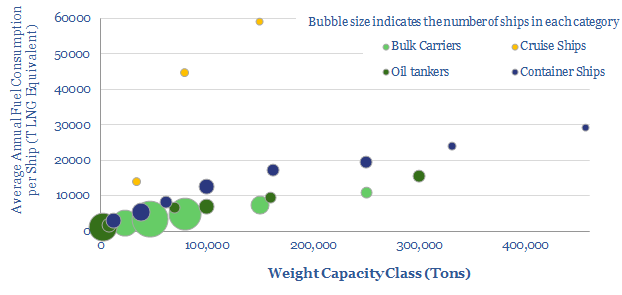
Global shipping and the switch from fuel oil?

The 240MTpa shipping-fuels market will be disrupted from 2020, under IMO sulphur regulations. Hence, this data-file breaks down the world’s 100,000-vessel shipping fleet into 13 distinct categories. We see 40-60MTpa upside to LNG demand from 2040.

Content by Category
- Batteries (89)
- Biofuels (44)
- Carbon Intensity (49)
- CCS (63)
- CO2 Removals (9)
- Coal (38)
- Company Diligence (95)
- Data Models (840)
- Decarbonization (160)
- Demand (110)
- Digital (60)
- Downstream (44)
- Economic Model (205)
- Energy Efficiency (75)
- Hydrogen (63)
- Industry Data (279)
- LNG (48)
- Materials (82)
- Metals (80)
- Midstream (43)
- Natural Gas (149)
- Nature (76)
- Nuclear (23)
- Oil (164)
- Patents (38)
- Plastics (44)
- Power Grids (130)
- Renewables (149)
- Screen (117)
- Semiconductors (32)
- Shale (51)
- Solar (68)
- Supply-Demand (45)
- Vehicles (90)
- Wind (44)
- Written Research (354)