Solar
-
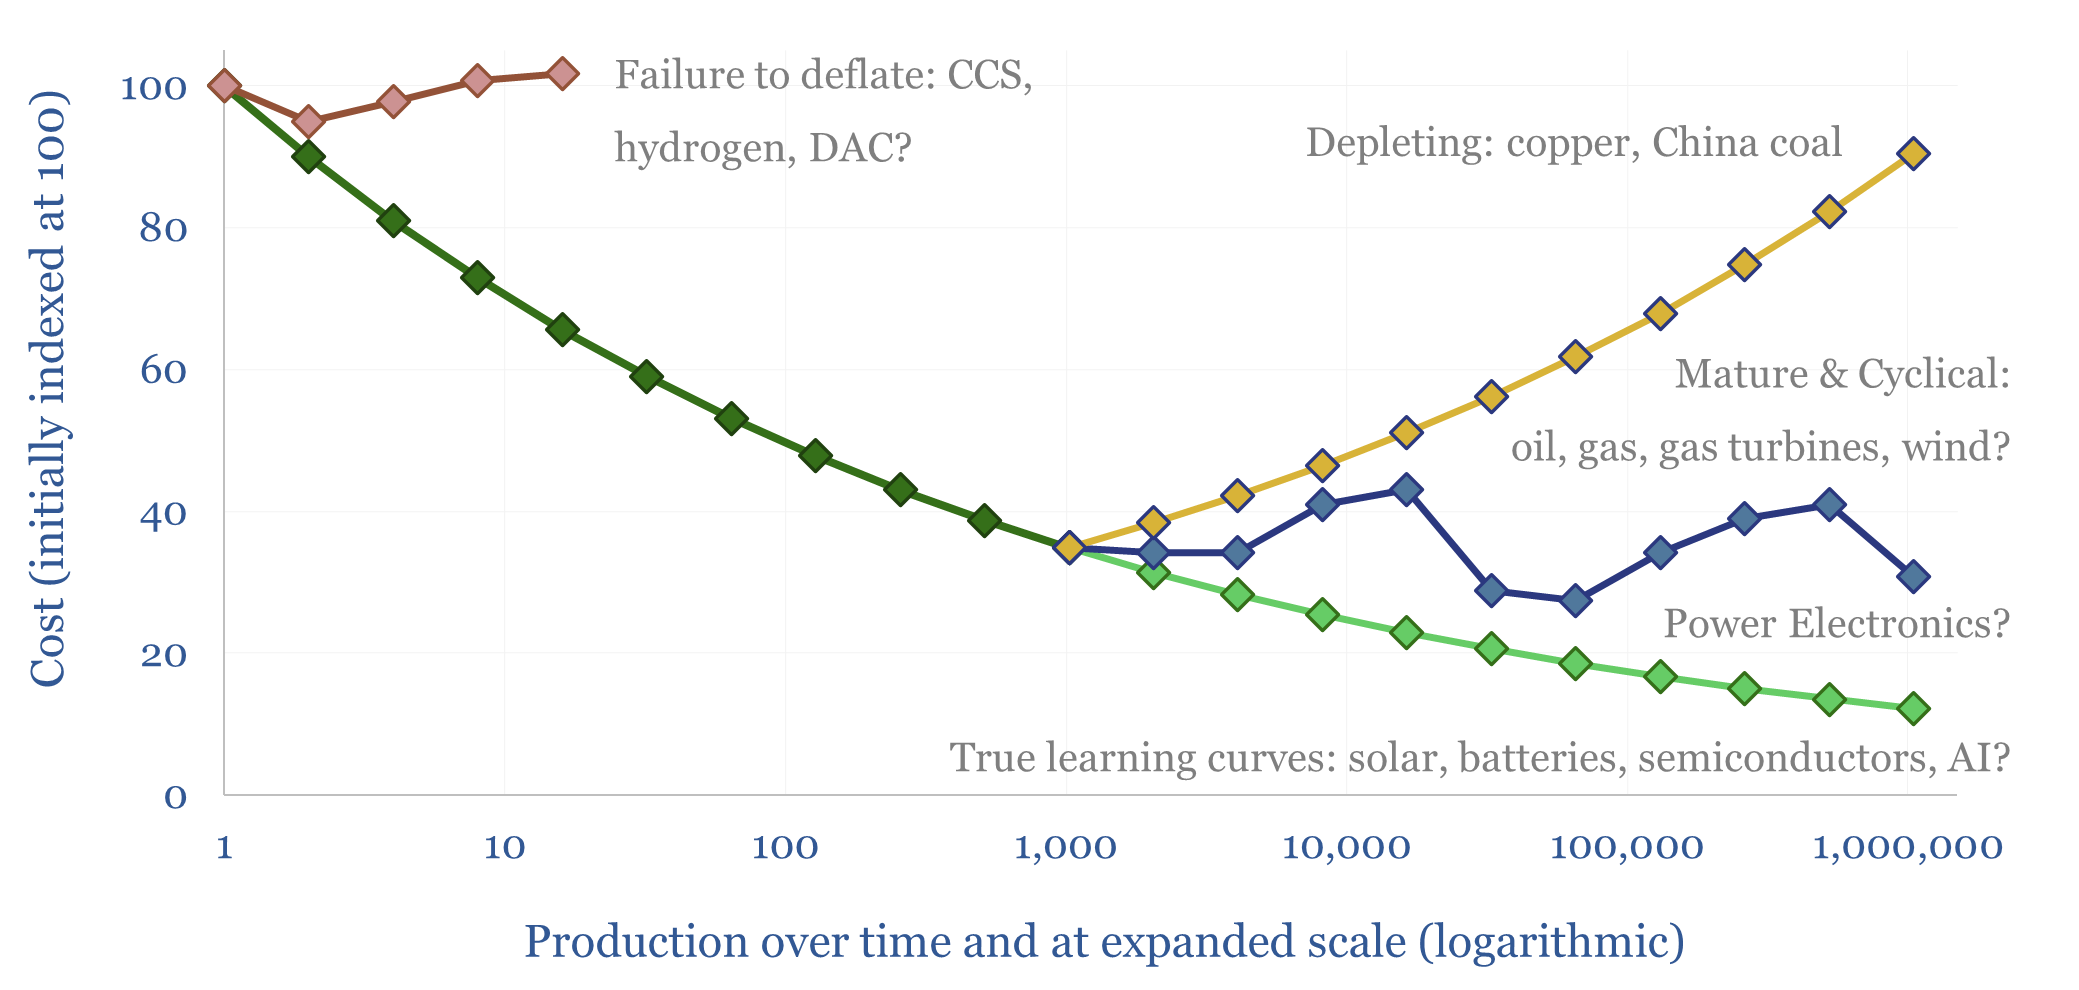
New energies deflation: myths and legends?

How much of the market’s current disenchantment with new energies can be attributed to persistently high costs, which failed to deflate as much as hoped? This 15-page report reviews the evidence. Cost trajectories have varied. CCS and hydrogen cost more than initially advertised. Wind costs recently re-inflated. Yet, solar, electronics and lithium ion batteries remain…
-
Perovskite solar: beyond silicon?
Will the next chapter of solar’s ascent come from perovskite-tandem cells, followed by perovskite-on-perovskites? This 18-page report finds more momentum than we expected. There is potential for 30% cost deflation, new solar applications (in buildings/vehicles), and a disruption of PV silicon?
-
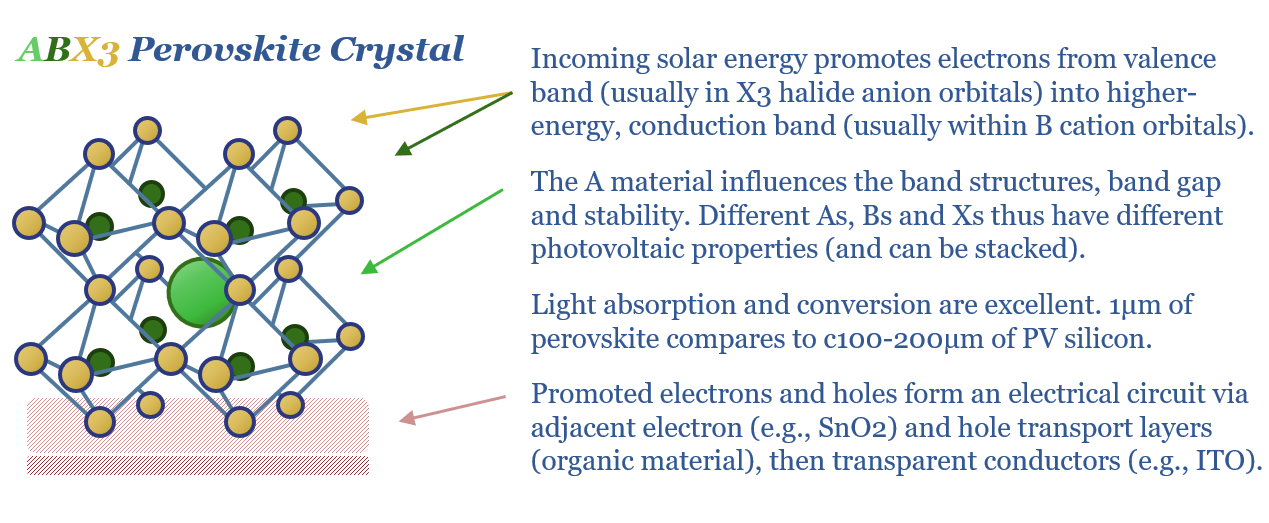
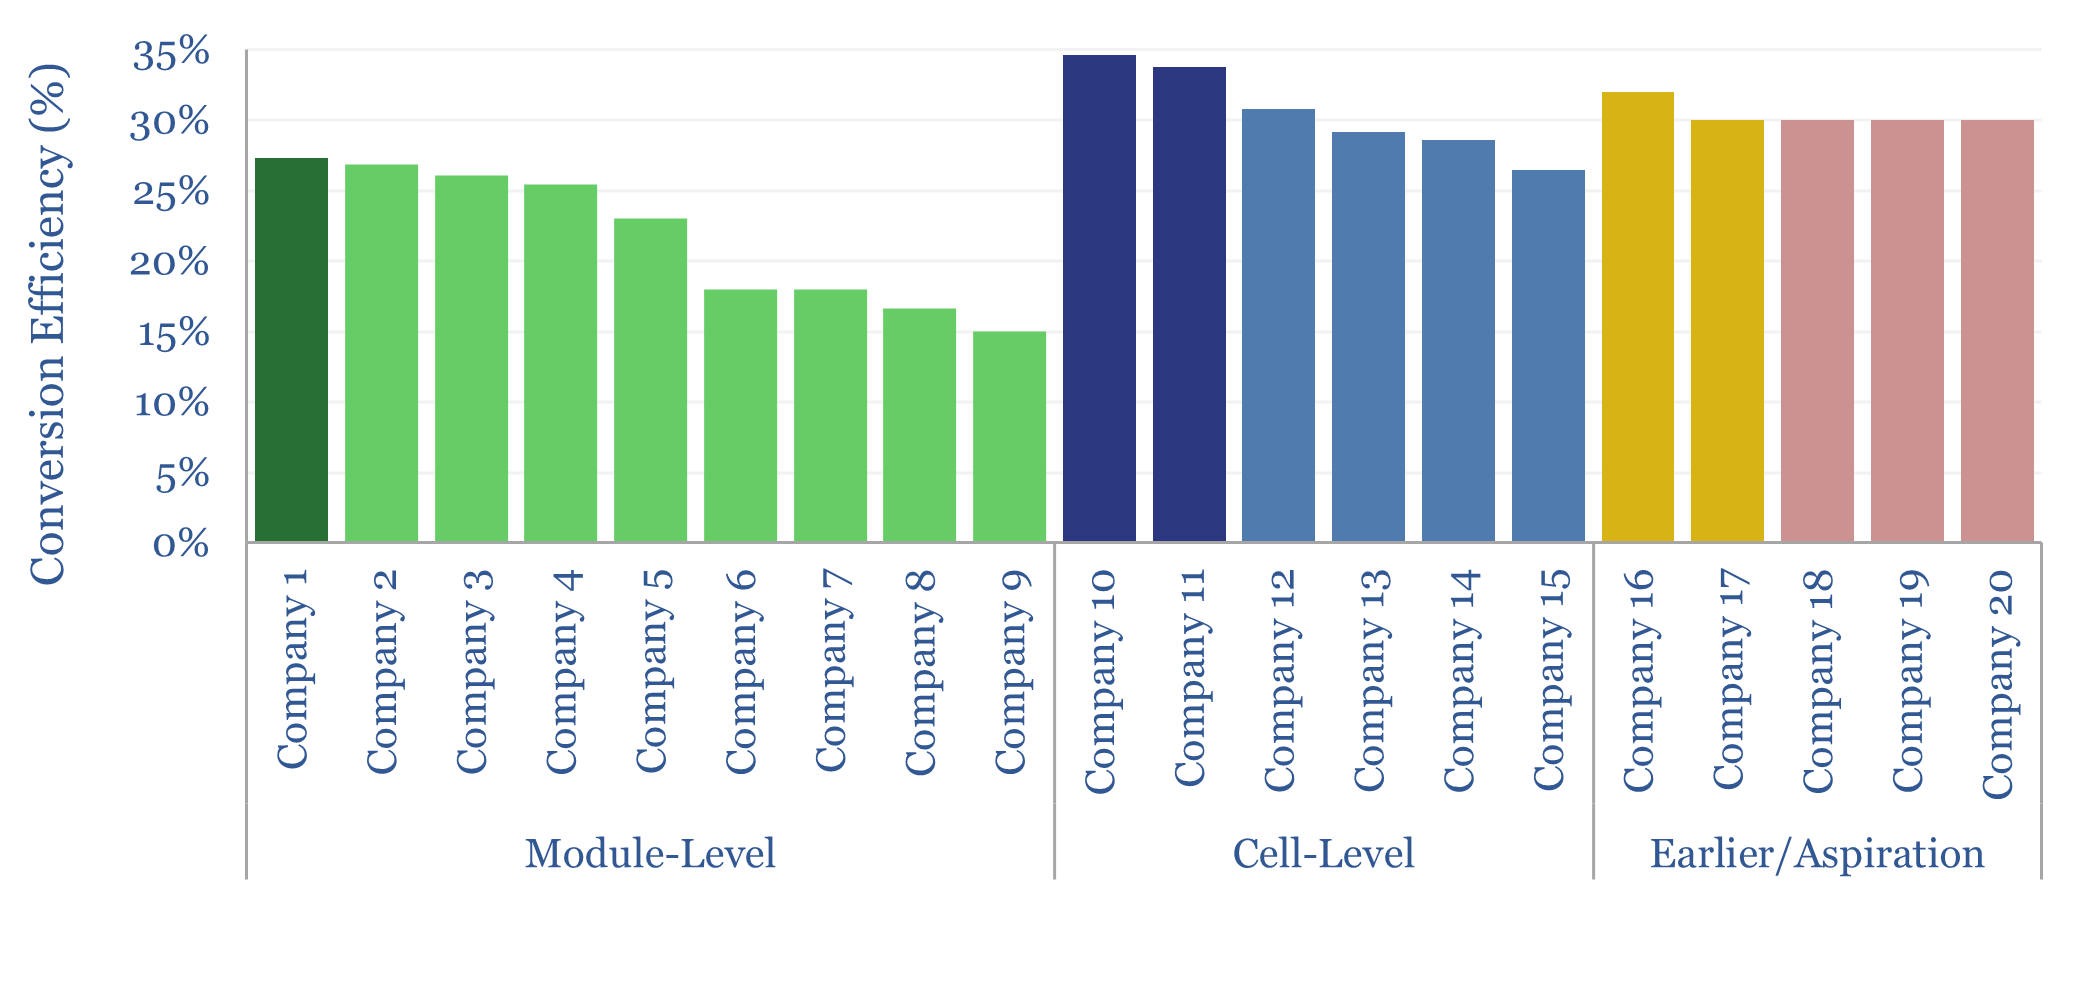
Perovskite solar companies screen?

This data-file is a screen of 20 perovskite solar companies, which are producing perovskite or perovskite-tandem modules at MW-GW scale, testing perovskite cells at lab scale with a view to future manufacturing, or early- or venture-stage companies that are developing new perovskite solar technologies. Perovskites are a class of materials with the structure ABX3, exceptionally…
-
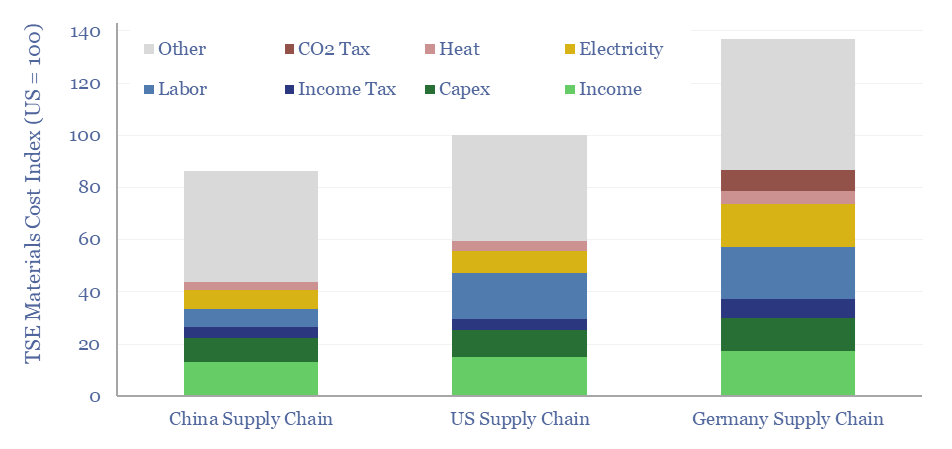
Material and manufacturing costs by region: China vs US vs Europe?

Material and manufacturing costs by region are compared in this data-file for China vs the US vs Europe. Generally, compared with the US, materials costs are 10% lower in China, and 40% higher in Germany, although it depends upon the specific value chain. A dozen different examples are contrasted in this data-file, especially for solar…
-
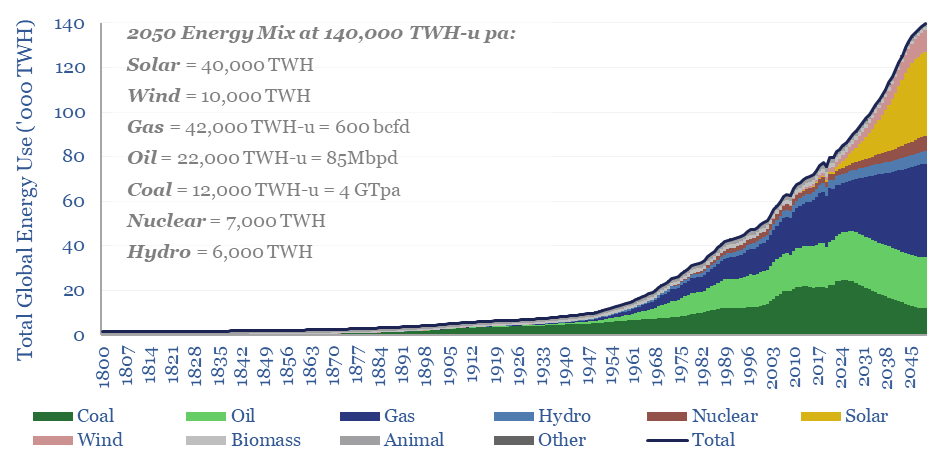
Energy transition: solar and gas -vs- coal hard reality?

This 15-page note outlines the largest changes to our long-term energy forecasts in five years. Over this time, we have consistently underestimated both coal and solar. Both are upgraded. But we also show how coal can peak after 2030. Global gas is seen rising from 400bcfd in 2023 to 600bcfd in 2050.
-
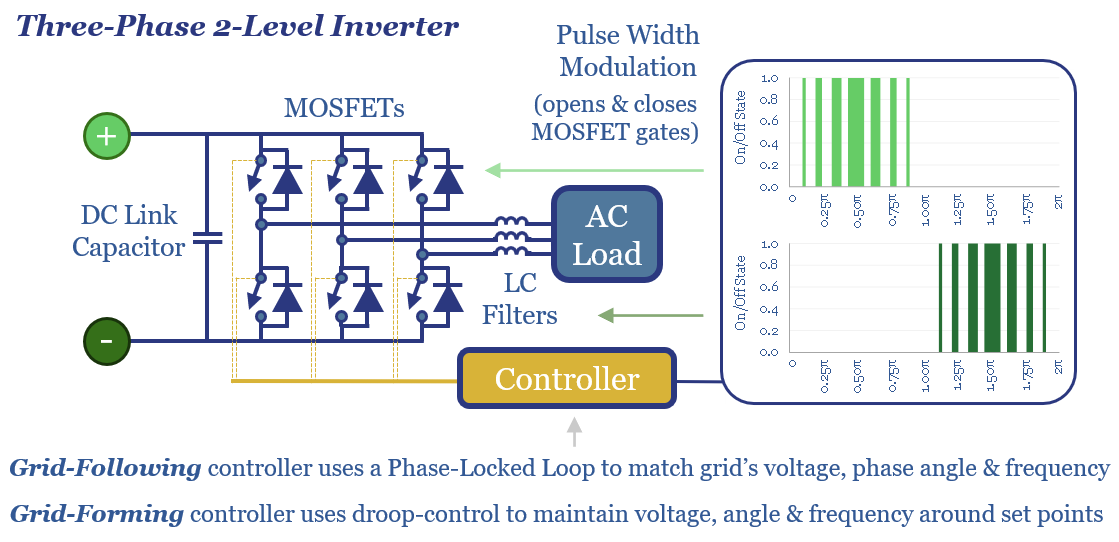
Grid-forming inverters: islands in the sun?

The grid-forming inverter market may soon inflect from $1bn to $15-20bn pa, to underpin most grid-scale batteries, and 20-40% of incremental solar and wind. This 11-page report finds that grid-forming inverters cost c$100/kW more than grid-following inverters, which is inflationary, but integrate more renewables, raise resiliency and efficiency?
-
Solar trackers: following the times?

Solar trackers are worth $10bn pa. They typically raise solar revenues by 30%, earn 13% IRRs on their capex costs, and lower LCOEs by 0.4 c/kWh. But these numbers are all likely to double, as solar gains share, grids grow more volatile, and AI unlocks further optimizations? This 14-page report explores the theme and who…
-
Solar trackers: leading companies?

This data-file summarizes the leading companies in solar trackers, their pricing (in $/kW), operating margins (in %), company sizes, sales mixes and recent news flow. Five companies supply 70% of the market, which is worth $10bn pa, and increasingly gaining in importance?
-
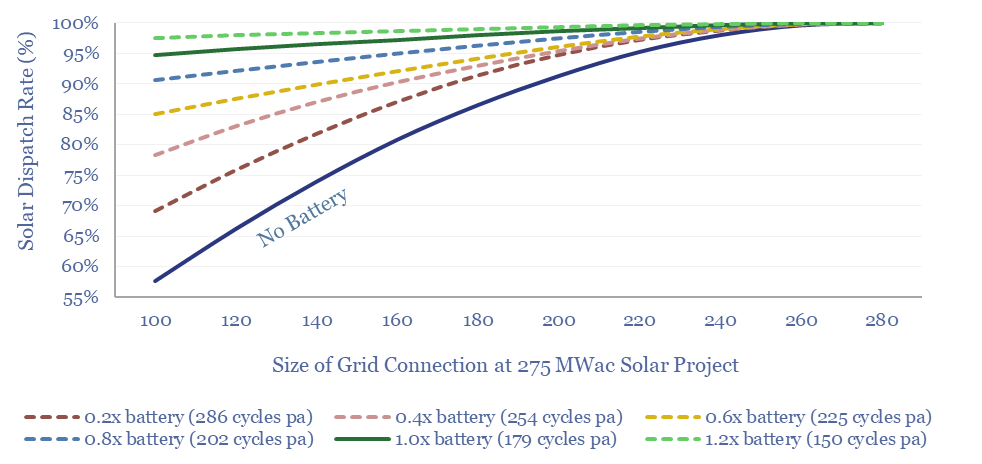
Solar plus batteries: the case for co-deployment?

This 9-page study finds unexpectedly strong support for co-deploying grid-scale batteries together with solar. The resultant output is stable, has synthetic inertia, is easier to interconnect in bottlenecked grids, and can be economically justified. What upside for grid-scale batteries?
-
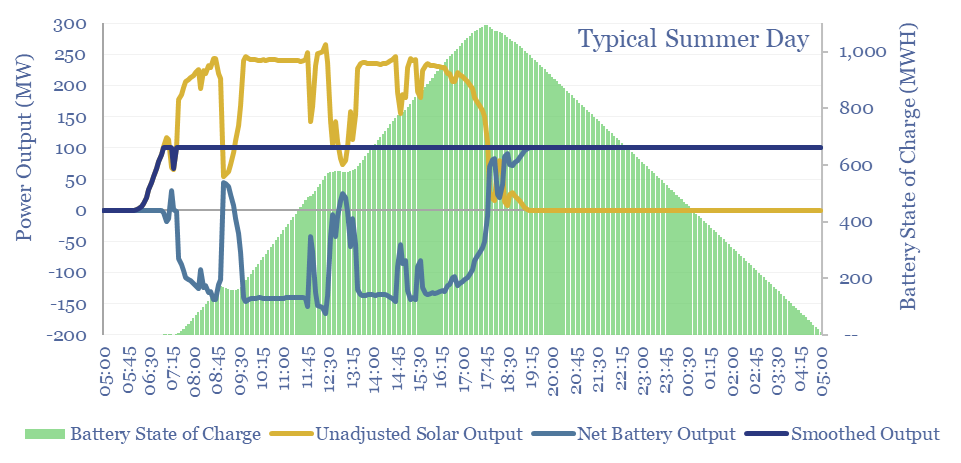
Solar+battery co-deployments: output profiles?

Solar+battery co-deployments allow a large and volatile solar asset to produce a moderate-sized and non-volatile power output, during 40-50% of all the hours throughout a calendar year. The smooth output is easier to integrate with power grids, including with a smaller grid connection. The battery will realistically cycle 100-300 times per year.
Content by Category
- Batteries (89)
- Biofuels (44)
- Carbon Intensity (49)
- CCS (63)
- CO2 Removals (9)
- Coal (38)
- Company Diligence (95)
- Data Models (840)
- Decarbonization (160)
- Demand (110)
- Digital (60)
- Downstream (44)
- Economic Model (205)
- Energy Efficiency (75)
- Hydrogen (63)
- Industry Data (279)
- LNG (48)
- Materials (82)
- Metals (80)
- Midstream (43)
- Natural Gas (149)
- Nature (76)
- Nuclear (23)
- Oil (164)
- Patents (38)
- Plastics (44)
- Power Grids (130)
- Renewables (149)
- Screen (117)
- Semiconductors (32)
- Shale (51)
- Solar (68)
- Supply-Demand (45)
- Vehicles (90)
- Wind (44)
- Written Research (354)