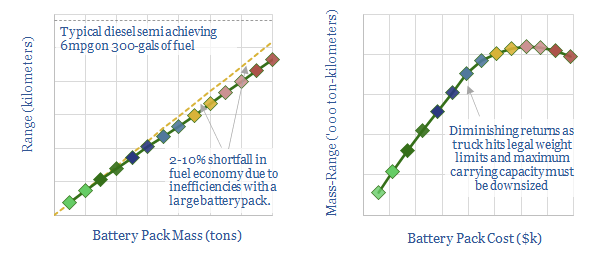
Electric trucks: what battery sizes?

Battery sizes for electric semi-trucks

This data-file models the possible battery sizes in a fully electric semi-truck. Lithium ion batteries up to 15 tons are considered, which could deliver 2,500 miles of range, comparable to a diesel truck.

However, large batteries above c8-tons in size detracts around 10% from the fuel economy of electric trucks, and may cause trucks to exceed regulatory weight limits, lowering their payload capacities.

4-6 ton batteries with 700-1000km ranges and 5-8% energy penalties may be best, and would likely add $110-170k of cost at 2020 battery costs. 

Our roadmap to decarbonize trucking most prefers carbon-offset diesel, then hybridization with super-capacitors, then electric semi-trucks, and least prefers hydrogen trucks.

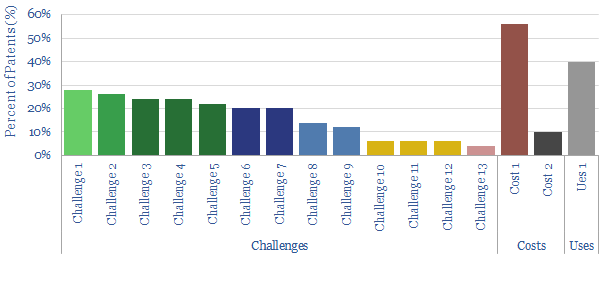
Proton exchange membrane fuel cells: what challenges?

Technical challenges for hydrogen fuel cells

This data-file reviews fifty patents into proton exchange membrane fuel cells (PEMFCs), filed by leading companies in the space in 2020, in order to understand the key challenges the industry is striving to overcome.

The key focus areas are controlling the temperature, humidity and longevity of hydrogen fuel cells. But unfortunately, we find over half of the proposed solutions are likely to increase end costs.

We remain cautious on the practicalities and the economics of hydrogen fuel cell vehicles (2x most costly than conventional vehicles per km, note here) and hydrogen fuel cells for power generation (10x more costly, note here).

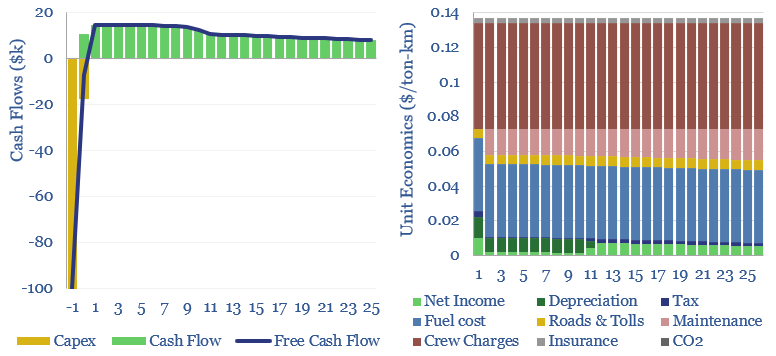
Heavy truck costs: diesel, gas, electric or hydrogen?

Heavy truck costs are estimated at $0.14 per ton-kilometer, for a truck typically carrying 15 tons of load and traversing over 150,000 miles per annum. Today these trucks consume 10Mbpd of diesel and their costs absorb 4% of post-tax incomes. Electric trucks would be 20-50% more costly, and hydrogen trucks would be 45-75% more, which is inflationary.


Heavy trucks, aka Class 8 trucks, consume 10Mbpd of oil, covering 1trn miles per year, moving substantively everything in global supply chains. Each truck typically carries around 15 tons of cargo, covering up to 1,000 miles per day, with a range of about 2,000-miles between fueling.

Heavy truck costs are estimated at $0.14 per ton-kilometer, for a typical vehicle, in the base case economics captured in this data-file. This is in the US. Additional fuel taxes apply in Europe.

Half of the costs of trucking comprises the labor costs of a driver, which accrue per hour or per year, and thus the ultimate per kilometer costs of truck transport depend on the amount of ground that can be covered. This is why utilization is crucial.

A standard diesel truck fills up 2 x 150-gallon tanks, imparting 2,000 miles of range, in about 5-minutes. A challenge for electric trucks, hydrogen trucks and other non-standard truck fuels is that fueling (or charging) may take materially longer (45-minutes for a hydrogen fuelling, up to 4-hours for a battery charging). Especially if a detour or a wait is needed to access scarce charging infrastructure.

Trucking costs and CO2 intensities of truck freight are compared in the data-file for diesel trucks, LPG trucks, CNG trucks, LNG trucks, electric trucks and hydrogen trucks (chart below).

Total trucking cost and CO2 emissions for different fuel types.

Electric trucks with 4-6 ton batteries, and 700-1,000km ranges, likely cost $110-170k more (i.e., 2x) than a typical diesel truck up-front. Fuel economy is 2x higher. Nevertheless, adding the costs of dedicated vehicle charging stations, the total energy costs can end up similar for both, especially in the US, where fuel taxes are lower.

Hydrogen trucks have been proposed for longer ranges, which could have fuel economies between diesel trucks and electric trucks. The key challenge is the high up-front costs of these fuel-cell vehicles, plus high cost of green hydrogen, which we estimate to be 2.5x higher than diesel trucks. We have also written on other challenges of hydrogen trucks.

Overall, the total costs of electric trucks are around 20% higher in Europe and 50% higher in the US; while the total costs of hydrogen trucks would be around 45% higher in Europe and 75% higher in the US. This is material. The look-through costs of trucking goods to meet the consumption needs of the average developed world citizen run to about $1,000 per person per year, or 4% of average post-tax incomes. 20-75% re-inflation eats up 1-3% of average incomes.

LNG trucks can be close to competitive. On an energy-equivalent basis, $3/mcf gas is 4x more economical than $3/gal diesel. However, the advantages are offset by higher vehicle costs, operational costs and logistical costs for LNG fueling stations. Mild environmental positives of gas are also offset by mild operational challenges.

This data-file compares different trucking fuels — diesel, CNG, LNG, LPG, electric trucks and Hydrogen — across 35 variables. Most important are the economics, which are fully modelled, in the 2020s in the US, in the 2020s in Europe and incorporating deflation in the 2040s.

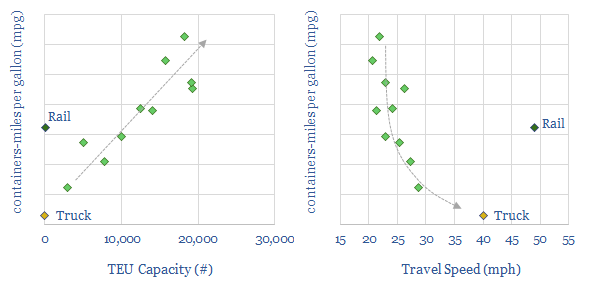
Container ships versus trucks and trains

Container ship fuel efficiency

This data-file tabulates c10 examples for the fuel economy of container vessels, which is a function of their size and speed.

The most efficient container ships are 2x more efficient than typical trains and 20x more efficient than typical trucks.

We calculate that moving goods from overseas to the developed world’s c1bn consumers accounts for c0.5% of global CO2 emissions (c50% in ships, c50% in trucks). These calculations are also shown in the data-file.

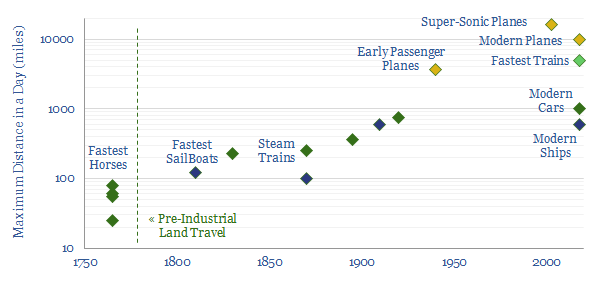
A Short History of Travel Speeds

History of Travel Speeds

This is our database of global travel speeds throughout history. It contains notes on the top travel-speeds attainable by different forms of transportation; plus more granular data on the average travel speeds in Britain since the 1970s.

Top travel speeds have increased by c100x since pre-industrial times, however in the past 20-years, the trend has reversed and begun slowing down. Average travel speeds are down c6-7% since 2000, connoting lower mobility.Travel Speed reports

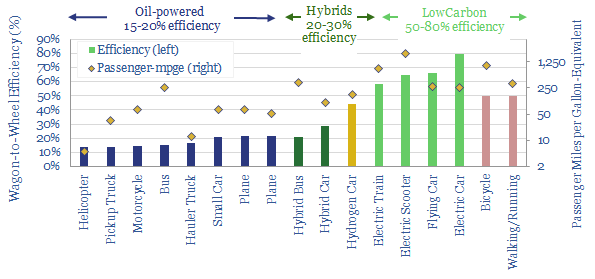
Vehicles: fuel economy and energy efficiency?

Vehicle fuel economy and energy efficiency

Vehicle fuel economy and energy efficiency are quantified in this data-file, looking across different transportation types: cars, trucks, buses, hybrids, electric vehicles (EVs), hydrogen cars, planes, trains, helicopters, plus other smaller vehicles such as bicycles, scooters, motor-cycles and simply ‘walking’.


Our numbers are built up for each category, in kWh-per-mile, miles-per-gallon, energy efficiency percentages and ultimate CO2 intensity per mile of travel. In turn, these numbers are built up from physics calculations, enthalpy calculations and technical disclosures of underlying companies.

A good rule of thumb is that a passenger car achieves 20-40mpg and 15-20% efficiency, depending on its size; a bus or truck achieves 5-10 vehicle miles per gallon, but this is equivalent to up to 50-250 passenger-equivalent miles per gallon, because of a higher load factor; and likewise a plane might achieve 0.2-0.5 vehicle miles per gallon, translating into 50-70 passenger miles per gallon, when you think of a plane as just a flying bus.

Electrification generally offers a c4x gain in vehicle fuel economy and energy efficiency, especially for ground-level vehicles, increasing efficiency from c15-20% on conventional oil-powered vehicles to c60-80% on electric vehicles. Hybrids and hydrogen also yield modest efficiency improvements.

Smaller vehicles are surprisingly exciting. This is just physics, but a bicycle achieves an effective fuel economy of 1,000 miles per gallon-equivalent, which is about 8x better than an electric vehicle, and even 3x better than walking (note here). Moreover, an emerging class of electric transportation technologies is fast, convenient and yet achieve 4-120x efficiency gains per passenger mile (note here).

Further data dis-aggregating the CO2 intensity per mile of electric vehicles versus ICE cars, depending on how they are powered, is linked here.

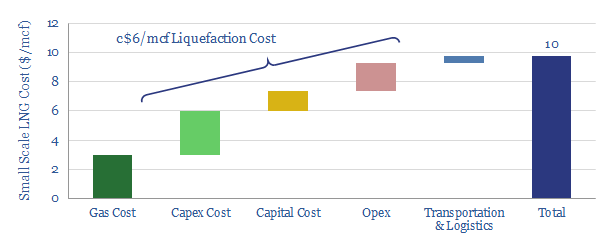
LNG in transport: scaling up by scaling down?

LNG as transport fuel

Next-generation technology in small-scale LNG has potential to reshape the global shipping-fuels industry. Especially after IMO 2020 sulphur regulations, LNG should compete with diesel. This note outlines the technologies, economics and opportunities for LNG as a transport fuel.

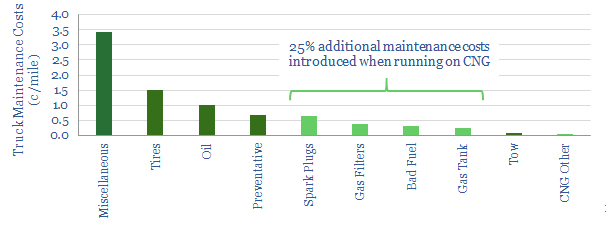
Maintenance costs for gas-powered trucks?

Maintenance costs for gas-powered trucks

This data-file tabulates the maintenance costs incurred by a fleet of 42x CNG-powered trucks, over 16M miles in the United States. Maintenance costs averaged 8c/mile, of which 1.6c/mile (i.e., 20%) was specifically attributed to running on CNG. Specifically, gas spark plugs must be replaced every 60,000 miles, niche maintenance operations are more expensive and in one instance, the truck engines were damaged by ‘wet fuel’.

Copyright: Thunder Said Energy, 2019-2024.