Wind
-
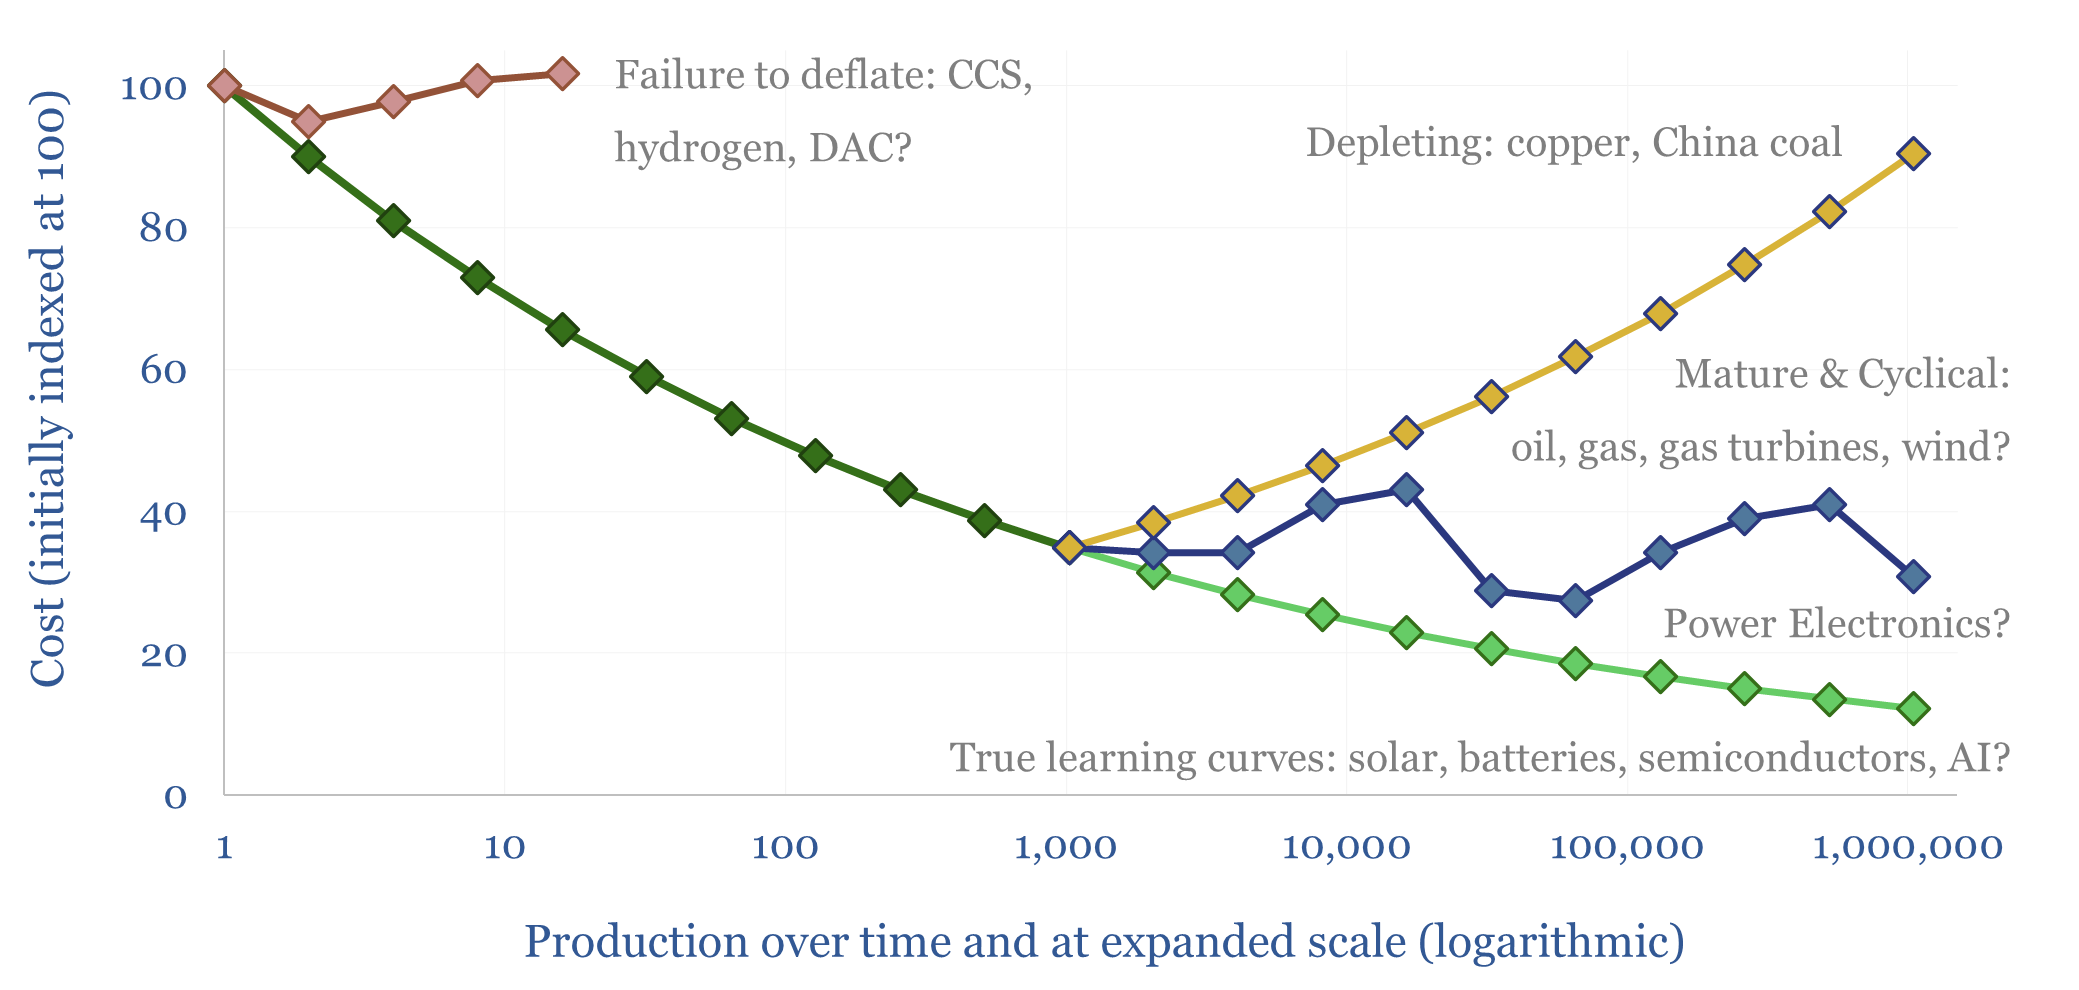
New energies deflation: myths and legends?

How much of the market’s current disenchantment with new energies can be attributed to persistently high costs, which failed to deflate as much as hoped? This 15-page report reviews the evidence. Cost trajectories have varied. CCS and hydrogen cost more than initially advertised. Wind costs recently re-inflated. Yet, solar, electronics and lithium ion batteries remain…
-
Wind energy: beyond good and evil?
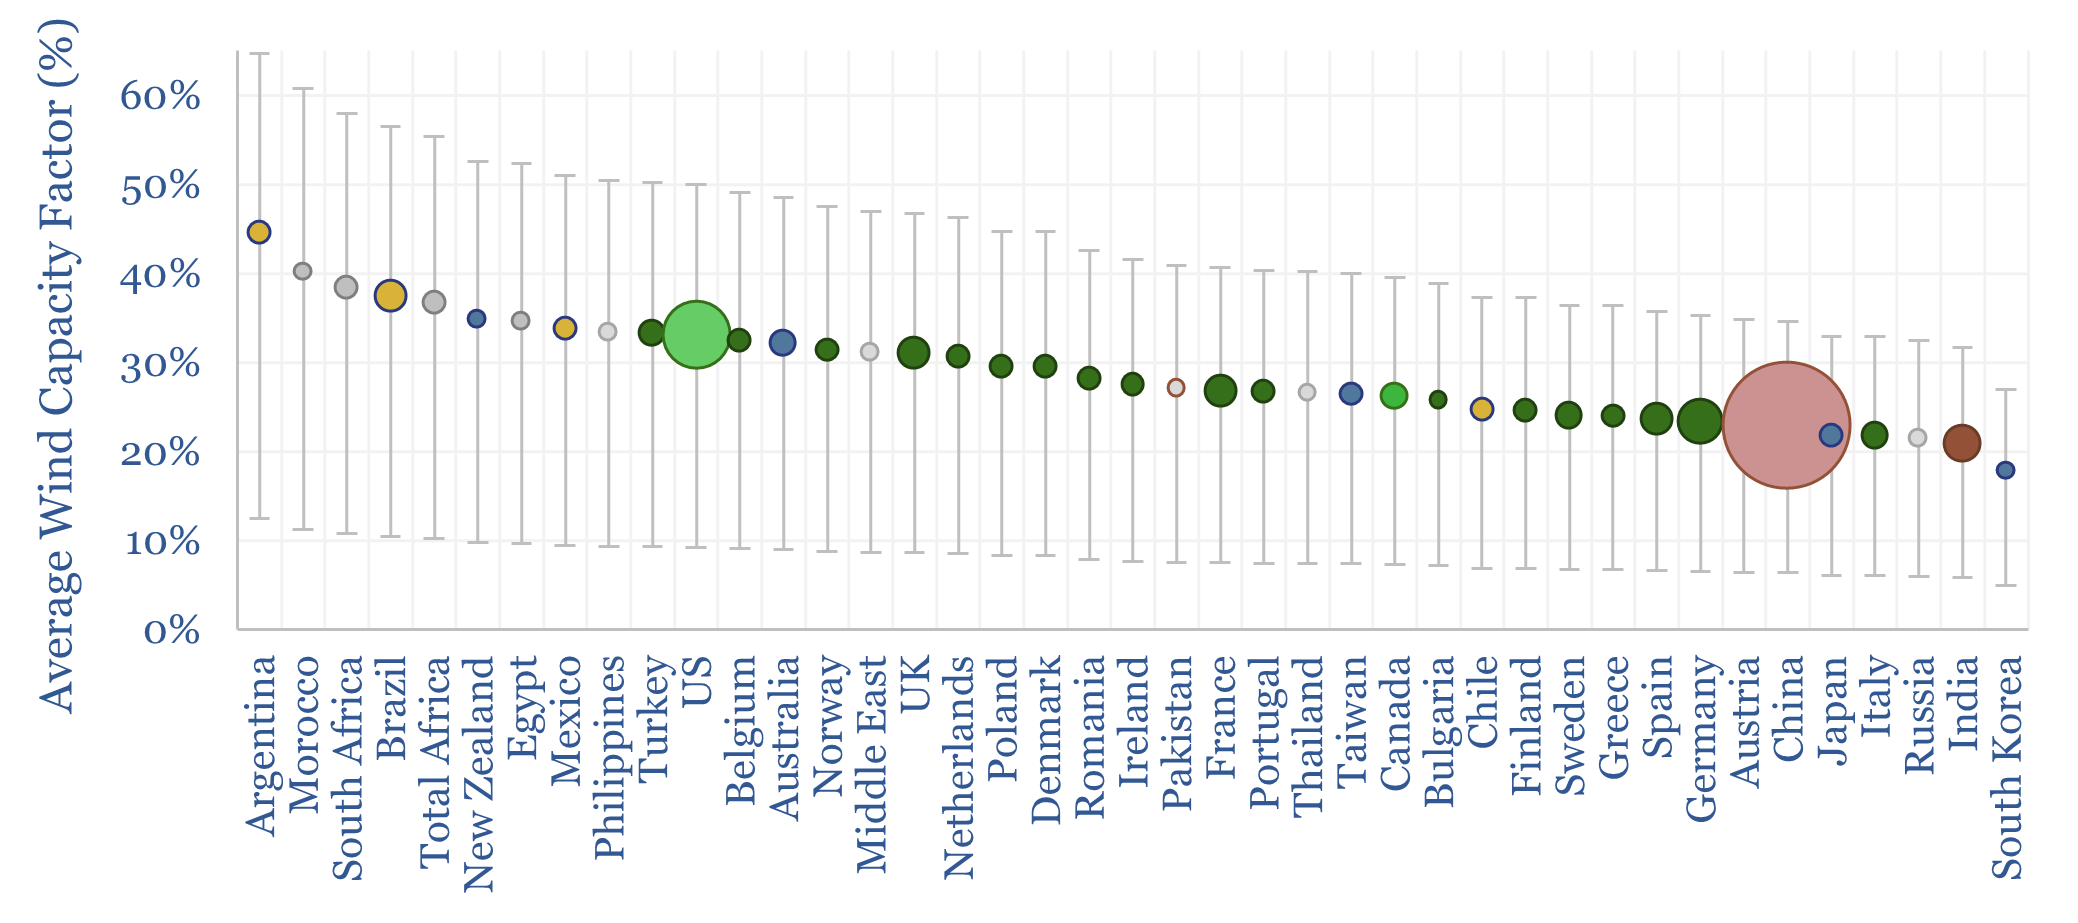
Wind economics are not good or bad in absolute terms. They depend on capacity factors, which average 26% globally, but can range from 10% to 60%. In the best locations, levelized costs are below 4c/kWh. Hence this 16-page note explores global wind capacity factors and updates our wind outlook by region throgh 2050.
-
Wind turbine capacity factors: by country, by facility?

Wind turbine capacity factors average 26% globally. But they vary from c20% in non-windy countries to 45% in the windiest countries. And they also vary within countries, with a normal distribution and a standard deviation of 7-12%. This data-file maps capacity factors of wind power generation.
-
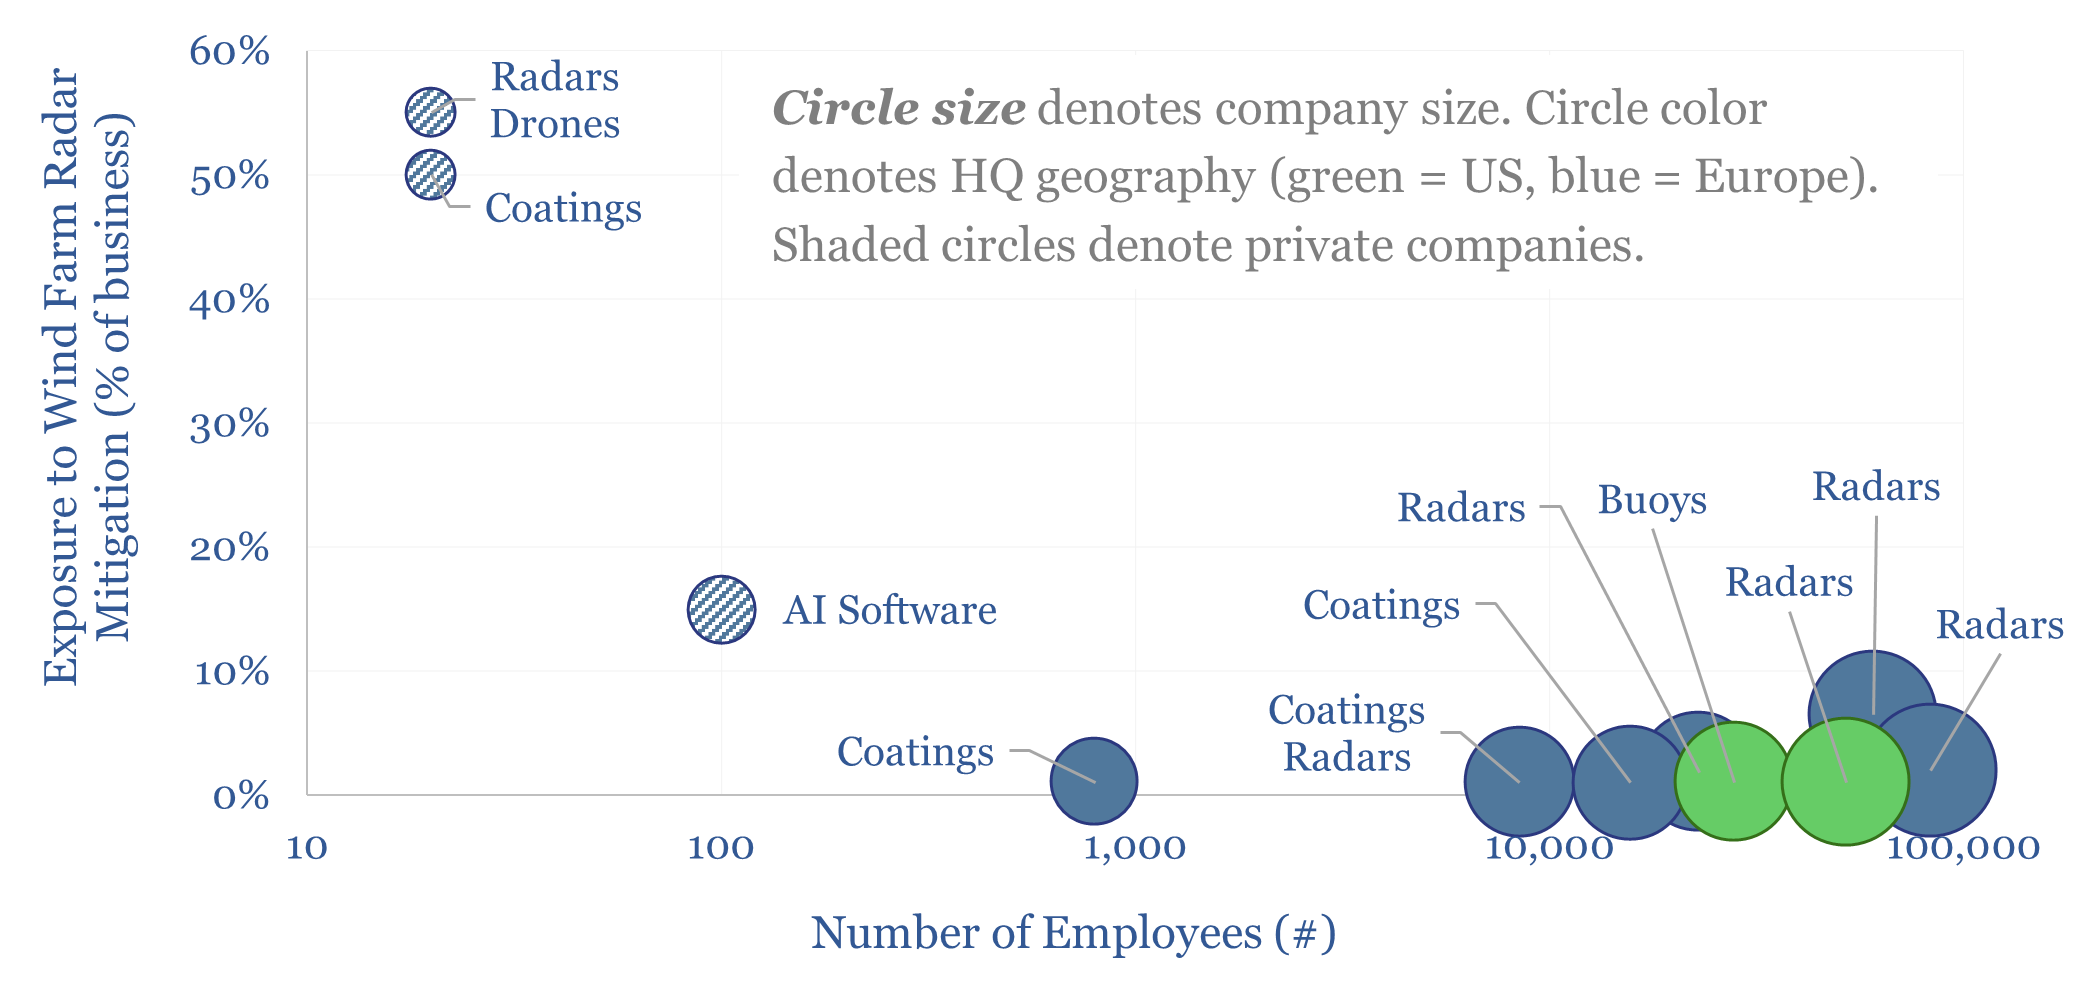
Companies mitigating radar interference of wind turbines?

Wind turbines create clutter and blind spots on radar systems, interfering with air traffic control, ocean monitoring and risks to national security and defence. These themes increasingly matter. Hence this data-file screens a dozen companies mitigating the radar interference of wind turbines, from large listed providers of next-gen radar systems, to start-ups developing nano-scale stealth…
-
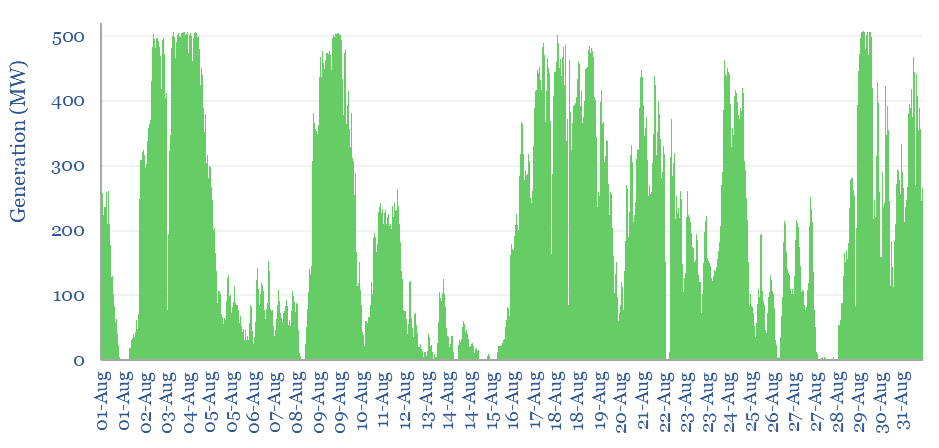
Wind generation case study: minute by minute volatility?

The volatility of wind generation is illustrated in this data-file, by aggregating the data for a large wind project in Australia, every five minutes, across an entire calendar year. Intra-day and inter-day volatility is 30-60% higher than for solar. 2-6 day feasts and famines are hard to backstop with batteries. Solar also cannibalizes wind?
-
Offshore wind: the lion, the witch and the wardrobe?

This 14-page report re-visits our wind industry outlook. Our long-term forecasts are reluctantly being revised downwards by 25%, especially for offshore wind, where levelized costs have reinflated by 30% to 13c/kWh. Material costs are widely blamed. But rising rates are the greater evil. Upscaling is also stalling. What options to right this ship?
-
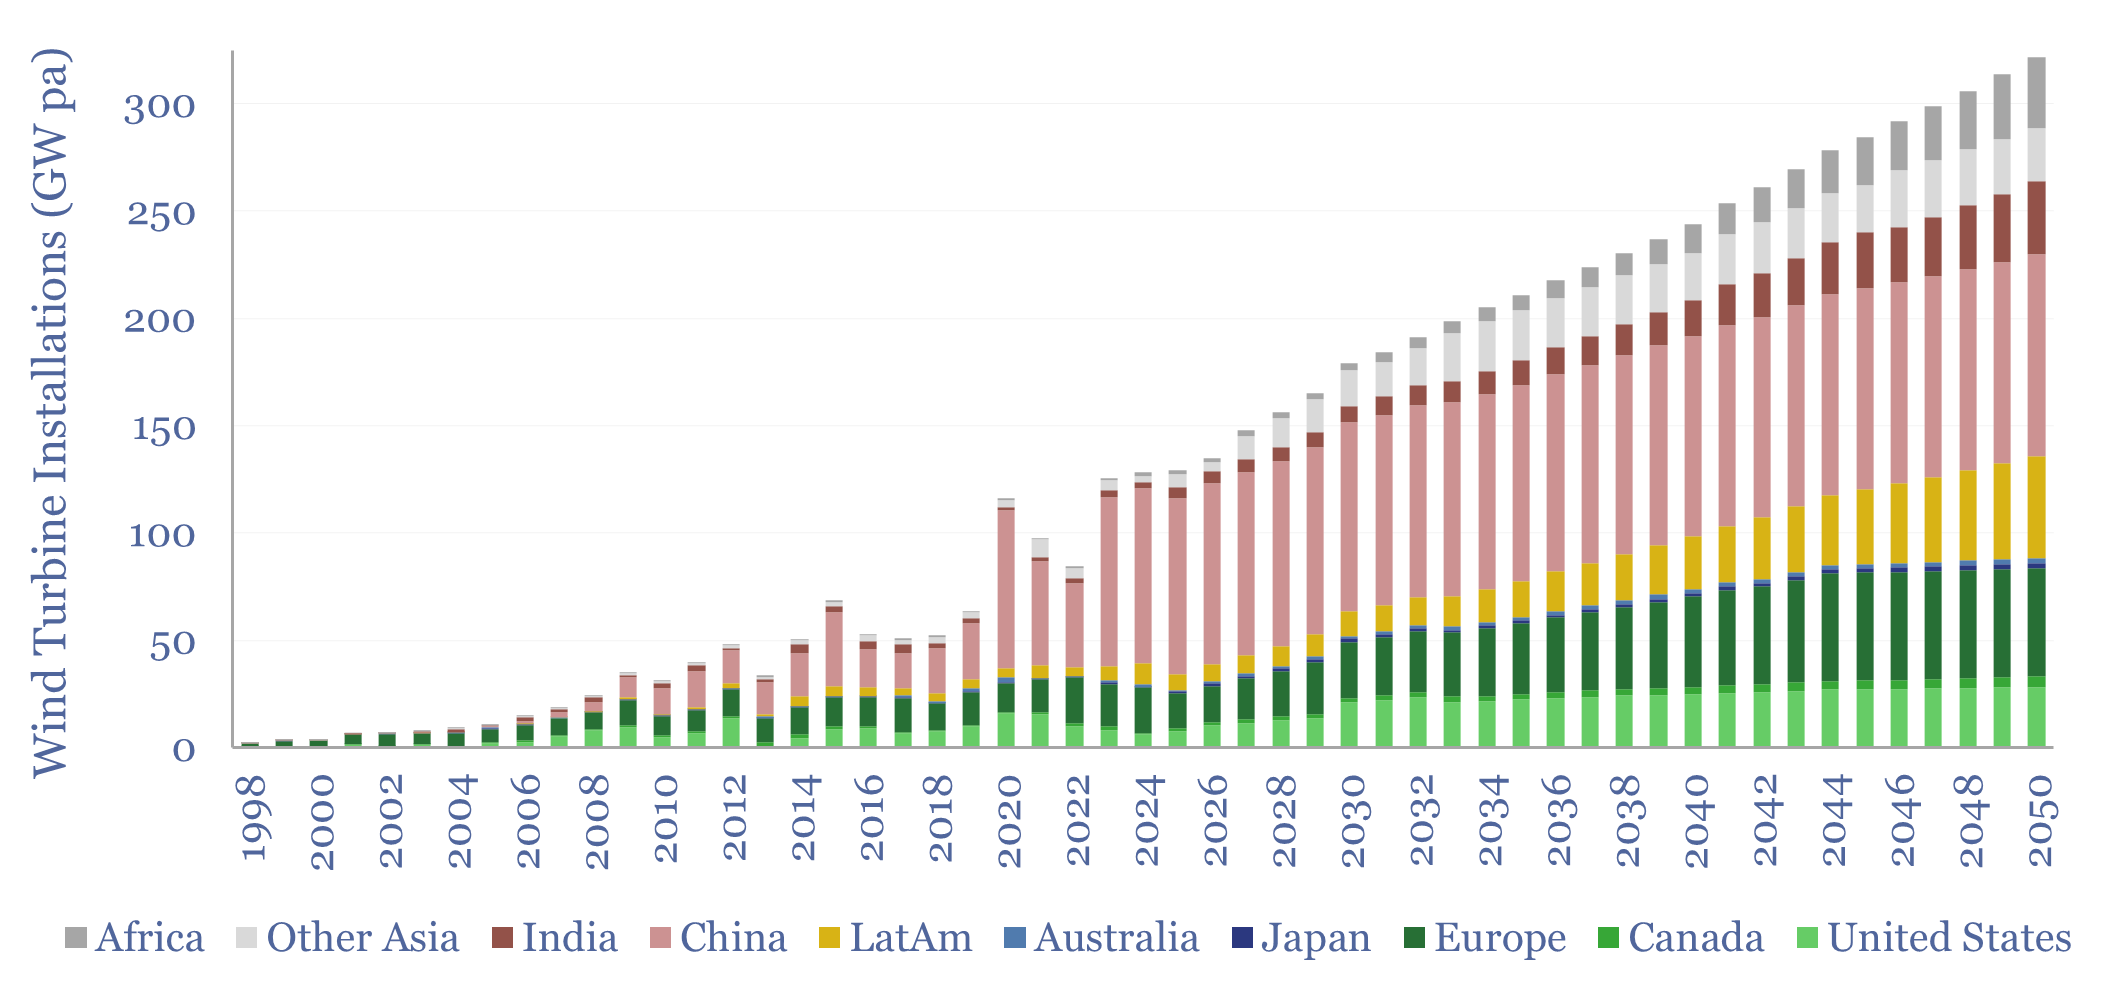
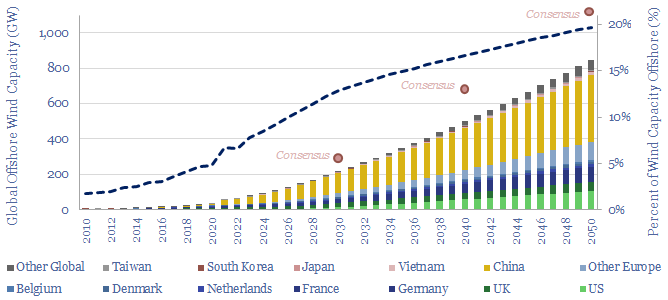
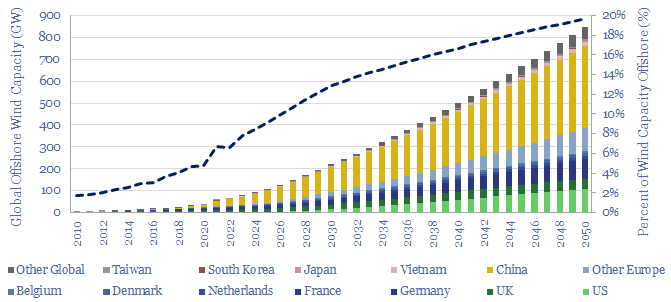
Offshore wind: capacity by country and forecasts?

Global offshore wind capacity stood at 60GW at the end of 2022, rising at 8GW pa in the past half decade, comprising 7% of all global wind capacity, and led by China, the UK and Germany. Our forecasts see 220GW of global offshore wind capacity by 2030 and 850GW by 2050, which in turn requires…
-
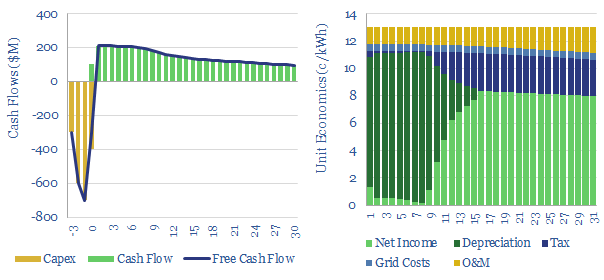
Offshore wind: levelized costs?

This model estimates the levelized cost of offshore wind at 13c/kWh, to generate a 7% IRR off of capex costs of $4,000/kW and a utilization factor of 40-45%. Each $400/kW on capex adds 1c/kWh and each 1% on WACC adds 1.3 c/kWh to offshore wind levelized costs.
-
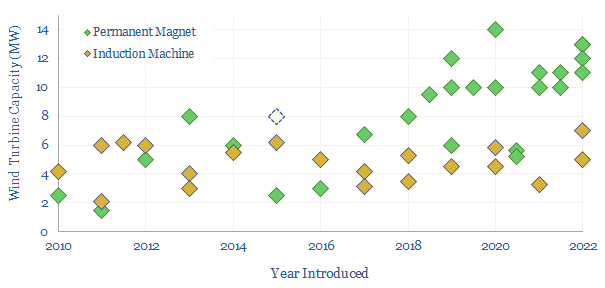
Wind turbine generators: DFIGs or Rare Earth magnets?

Wind turbines can use doubly fed induction generators (DFIGs) or permanent magnet synchronous generators (PMSGs) based around Rare Earth metals. This data-file captures the trends in DFIGs vs PMSGs over time by tabulating 40 examples, as turbines have grown larger, and different wind turbine manufacturers have adopted different strategies.
-
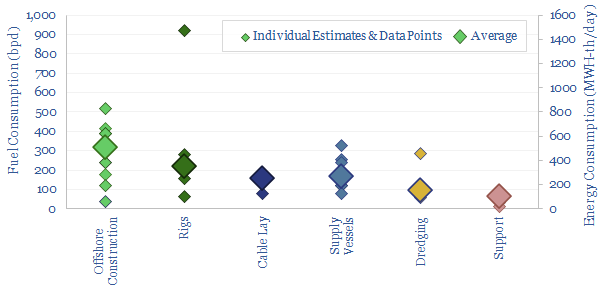
Offshore vessels: fuel consumption?

This database tabulates the typical fuel consumption of offshore vessels, in bpd and MWH/day. We think a typical offshore construction vessel will consume 300bpd, a typical rig consumes 200bpd, supply vessels consume 150bpd, cable-lay vessels consume 150bpd, dredging vessels consume 100bpd and medium-sized support vessels consume 50bpd. Examples are given in each category, with typical…
Content by Category
- Batteries (89)
- Biofuels (44)
- Carbon Intensity (49)
- CCS (63)
- CO2 Removals (9)
- Coal (38)
- Company Diligence (95)
- Data Models (840)
- Decarbonization (160)
- Demand (110)
- Digital (60)
- Downstream (44)
- Economic Model (205)
- Energy Efficiency (75)
- Hydrogen (63)
- Industry Data (279)
- LNG (48)
- Materials (82)
- Metals (80)
- Midstream (43)
- Natural Gas (149)
- Nature (76)
- Nuclear (23)
- Oil (164)
- Patents (38)
- Plastics (44)
- Power Grids (130)
- Renewables (149)
- Screen (117)
- Semiconductors (32)
- Shale (51)
- Solar (68)
- Supply-Demand (45)
- Vehicles (90)
- Wind (44)
- Written Research (354)