New technologies for the energy transition range across renewables, next-gen nuclear (fission and fusion), next-gen materials, EV charging, battery designs, CCS technologies, electronics, recycling, vehicles, hydrogen technologies and advanced bio-fuels. But which companies and technologies can we de-risk?
One way to appraise new technologies for the energy transition is to lock yourself in a room with a stack of patents from publicly available patent databases, read the patents, and then score them all on an apples-to-apples framework.
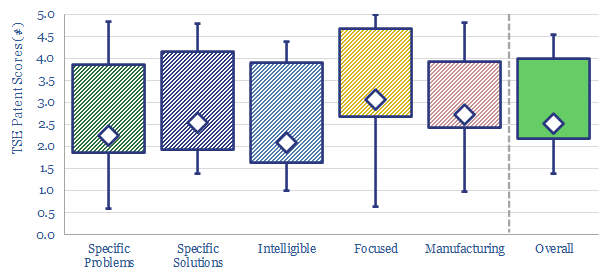
Our technology assessment framework is derived from 15-years experience evaluating energy technologies, from the best of the best world-changing technologies, to companies that ultimately turned out to have over-promised. The framework includes five areas:
(1) Specific problems. We find it easier to de-risk patents that pinpoint specific problems that have hampered others, and set about to solve these problems.
(2) Specific solutions. We find it easier to de-risk patents that pose specific solutions, whereas it is harder to de-risk technologies that are more vague.
(3) Intelligibility. We find it easier to de-risk patents that explain why their inventions work, often including empirical data and underlying scientific theory.
(4) Focused. We find it easier to de-risk patents that all point towards commercializing a common invention, and different aspects of that invention. Conversely, patenting 10 totally different solutions might suggest that a company has not yet honed in upon a final product.
(5) Manufacturing details. We find it easier to de-risk patents that explain how they plan to manufacture the inventions in question. Sometimes, very specific details can be given here. Otherwise, it may suggest the invention is still at the ‘science stage’.
The purpose of this data-file is to aggregate all of our patent assessments in a single reference file, so different companies’ scores can be compared and contrasted. The average score in our patent assessment framework is 3.5 out of 5.0, although there is wide variability in each category.
In each case, we have tabulated the scores we ascribed each company on our five different screening criteria, metrics on the companies’ size and technical readiness and a short description of our conclusion. You can also view all of our individual patent assessments chronologically.
