Wind and solar curtailments now average 8% across different grids that we have evaluated in this data-file, and have generally been rising over time, especially in 2024. The key reason is grid bottlenecks. Grid expansions are crucial for wind and solar to continue expanding.
Curtailments occur when wind and solar are capable of generating electricity, but operators cannot dispatch that electricity into the grid.
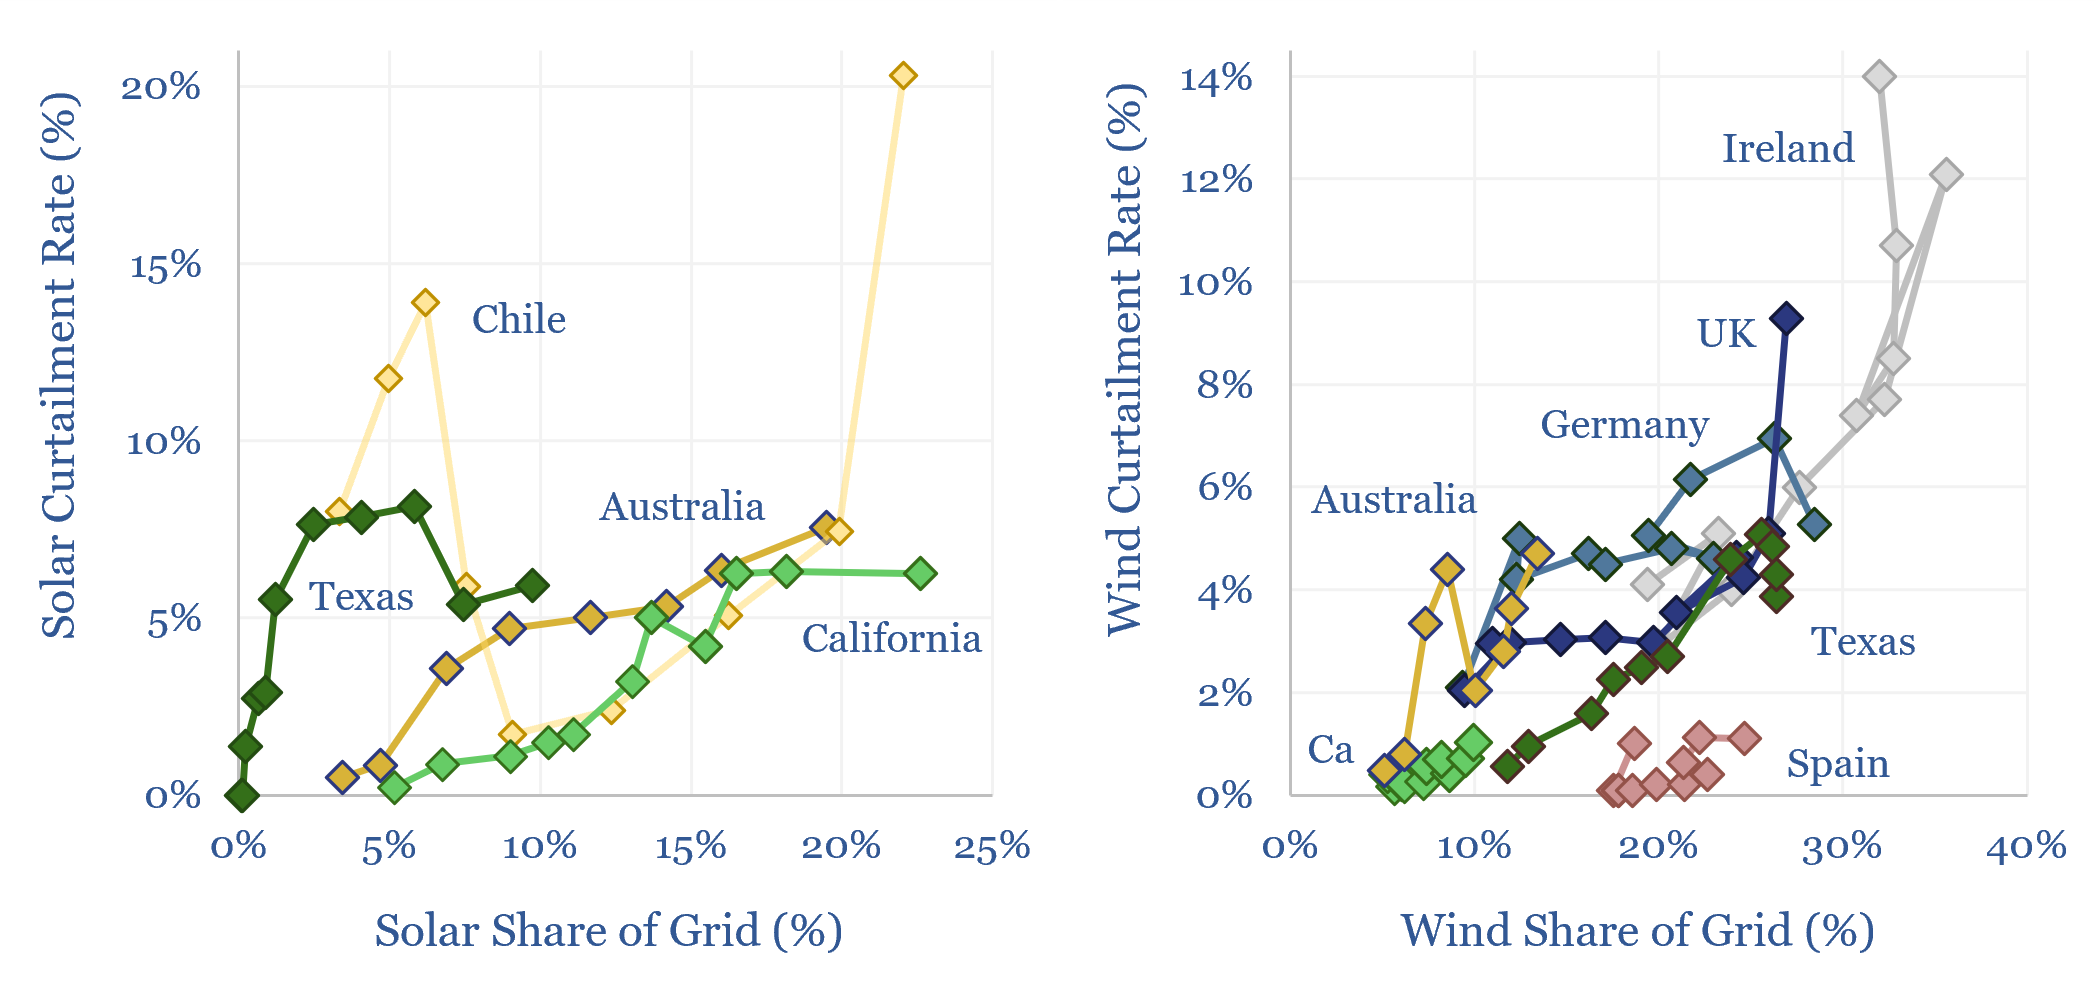
This data-file tabulates curtailment rates in California, Australia, the UK, Germany, Spain, Chile and Ireland, averaging c5% in 2022.
The main reason for curtailment is bottlenecks in the grid — i.e., moving renewables from points of generation, to points of unmet demand — rather than renewables having saturated total grid demand.
In a recent research report into the ultimate share of renewables in power grids, we calculated that based on their statistical distributions, solar would only start meeting 100% of a grid’s total demand around 1% of the time when solar was providing c30% of the total grid, while wind would only start meeting 100% of a grid’s total demand around 1% of the time when wind was providing 40% of the total grid (see below). We are not at these levels yet, in the countries in this sample.
The bottleneck is power grids. You might have a 100MW grid, composed of 10 x 10MW inter-connected nodes, and the issue causing curtailment is trying to flow 20MW through a 10MW node.
This confirms that meeting the theoretical potential of renewables (per the note above) requires vast grid expansion, and indeed, countries that have seen YoY reductions in curtailment rates have often achieved this by building new interconnectors.
Second, it gives a new lens on energy storage. Battery deployments can absorb low-cost renewables and prevent curtailment, by circumventing grid bottlenecks, especially for renewables developers who fear bottlenecks in the grid will be persistent.
The biggest YoY increase in 2024 was in Chile, whose own renewable energy association (ACERA) fears that the YoY jump in solar curtailment (+2.7 TWH) actually surpassed the YoY jump in solar generation (+2.2 TWH), implying that effectively all of the new solar additions got curtailed. Either the grid expands, or demand for batteries co-deployments will rise sharply.
The second biggest YoY increase was in the UK, where 9% of all wind generation was curtailed, at an estimated cost of about £1bn. One wind project in Scotland apparently saw 70% of its output cut by grid congestion.
Underlying data on wind and solar curtailments, by region, over time, are available in the data-file.