Search results for: “climate model”
-
US gas pipeline capex over time?
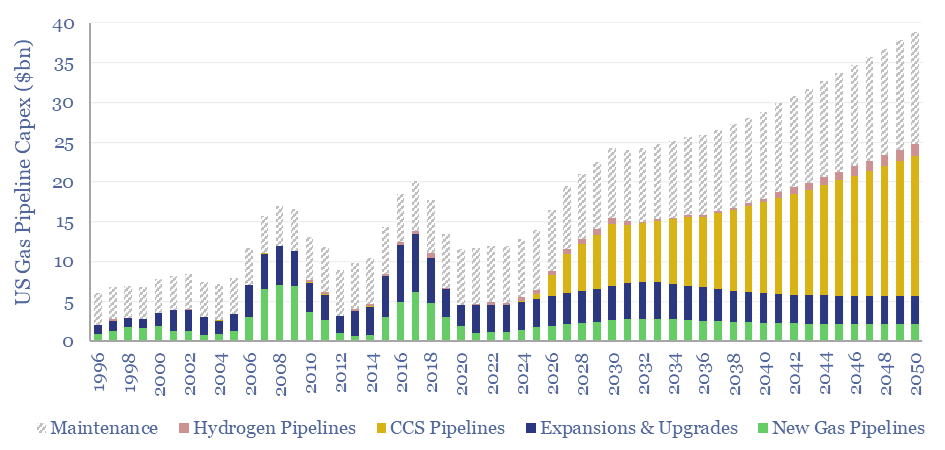
US gas pipeline capex ran at $12bn pa in 2023, but likely needs to treble to reach net zero by 2050, mainly to support 1GTpa of CCS. Midstream capex for natural gas, CO2 transportation and hydrogen production are forecast out to 2050 in this data-file. Numbers can be stress-tested in the model.
-
Gold hydrogen: the economics?
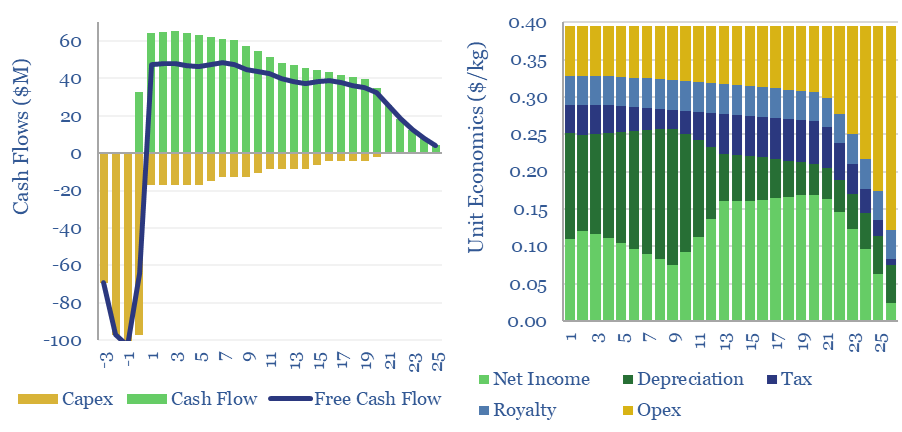
Natural hydrogen could be recovered from the Earth’s subsurface, with costs ranging from $0.3-10/kg, and CO2 intensities of 0.2-5.0 kg/kg. This data-file models the economic costs of gold hydrogen, and its sub-variants such as white hydrogen and orange hydrogen.
-
Plastic recycling: the economics?
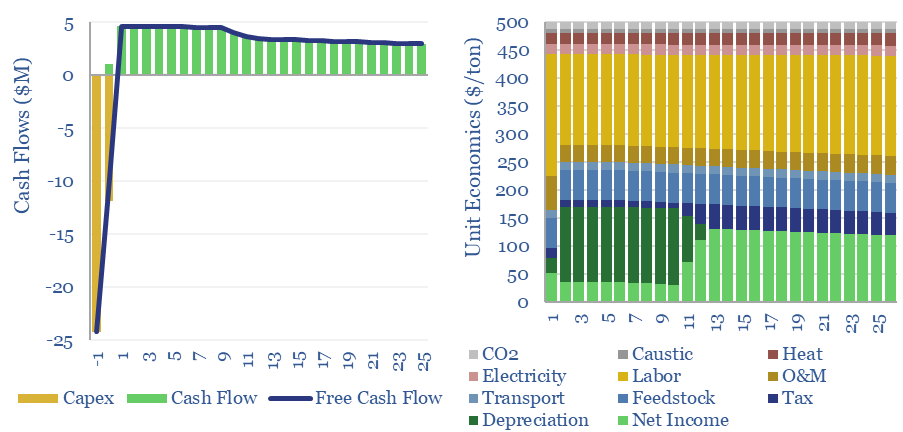
Plastic recycling requires a $500/ton product price, to earn a 10% IRR off of c$1,000/Tpa of up-front capex, at a mechanical recycling facility with 0.3 tons/ton of CO2 intensity (up to 80-90% below virgin plastics, more than we expected). This data-file captures the economics and the costs of plastic recycling, especially for the mechanical recycling…
-
Rare Earth mining and refining: the economics?
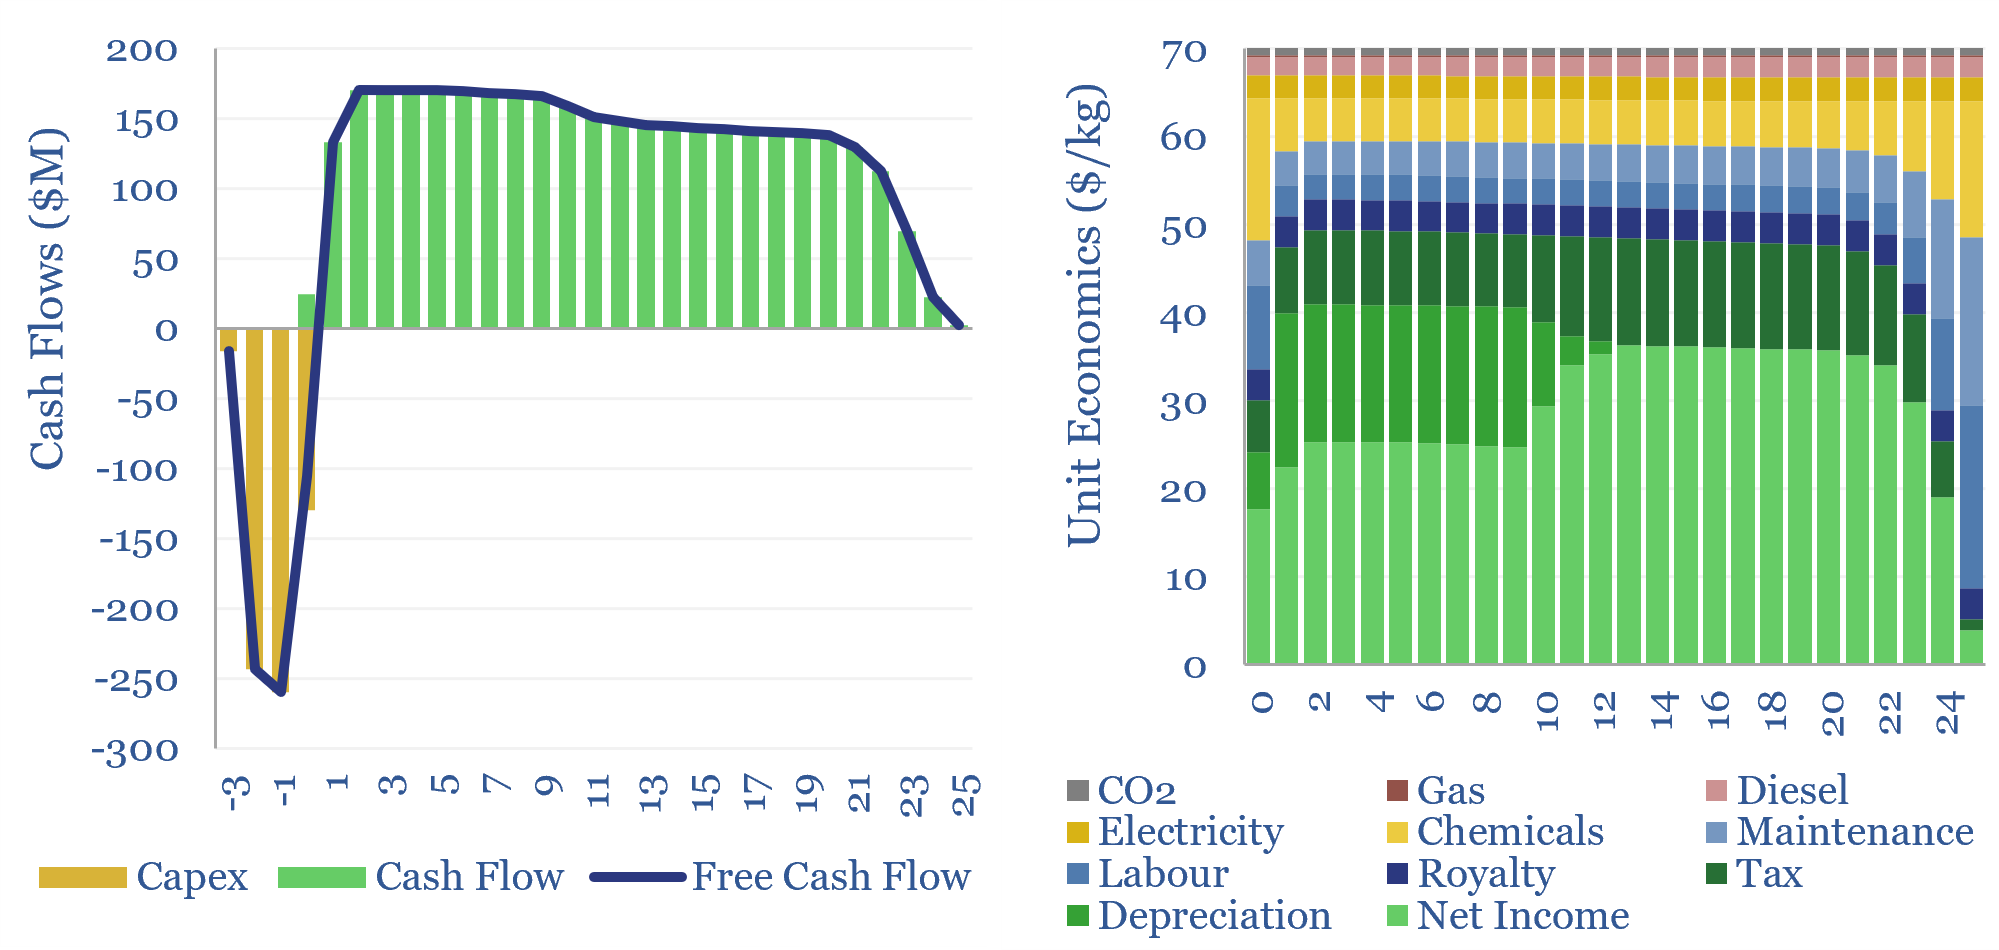
The costs of Rare Earth mining and refining are captured in this model, requiring a $70/kg blended product price, to generate a 20% IRR on $150,000/Tpa of capex. Primary energy intensity exceeds 100 MWH/ton and CO2 intensity exceeds 20 tons/ton. Economics are particularly sensitive to ore grade, recovery rates and chemical costs.
-
Should a shale rig switch to gas-fuel?
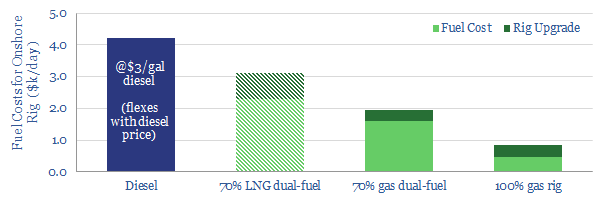
Should a shale rig switch to gas-fuel? We estimate that a dual-fuel shale rig, running on in-basin natural gas would save $2,300/day (or c$30k/well), compared to a typical diesel rig. This is after a >20% IRR on the rig’s upgrade costs. The economics make sense. However, converting the entire Permian rig count to run on…
-
Plastic pyrolysis delivers strong economics?
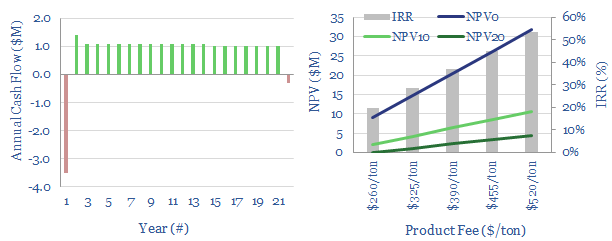
>30% IRRs should be attainable converting waste-plastic back into oil, based on disclosures from technology-leaders in the sector. This economic model allows for stress-testing of product prices, input costs, gate fees, capex, opex, utilisation and fiscal regimes.
-
Plastic Recycling Companies: pyrolysis and next-generation recycling?
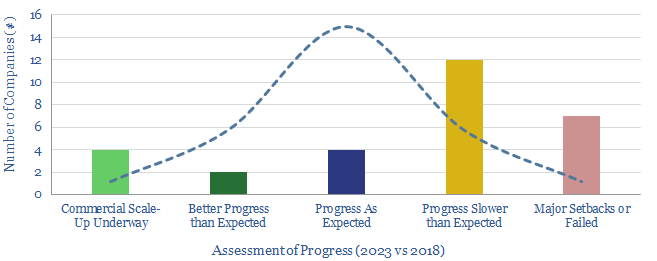
This data-file assesses the outlook for 30 plastic pyrolysis companies, operating (or constructing) 100 plants around the world, which use chemical processes to turn waste plastic back into oil. The data-file has been updated in 2023, concluding that the theme is ‘on track’, but segmented between leaders and setbacks.
-
Do “digital” completions lift Permian IRRs?
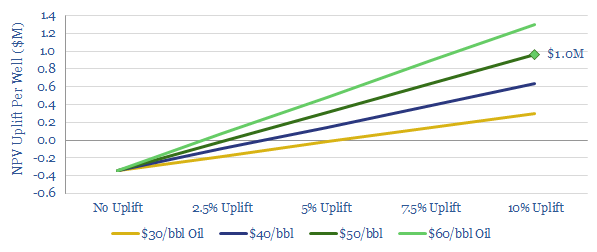
We have modelled the economic uplift of extra digital instrumentation on a typical Permian well. At $50/bbl oil, c$0.4M of extra instrumentation costs, which add 10% to well-productivity, will raise overall NPV by $1M and IRR by 5pp per well.
-
Re-Frac Economics. How much uplift?
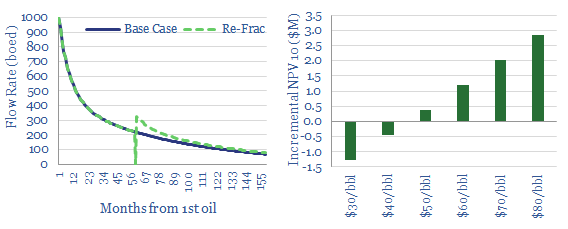
Re-fracturing Permian and Eagle Ford shale wells holds potential at higher oil prices. Our base case assumes $0.5M NPV/well uplifts, and $45/bbl breakevens. Higher prices and process-enhancements can unlock $2-3M of NPV10/well. Oxy and Devon lead the technical literature.
-
LNG as a Shipping Fuel: the Economics
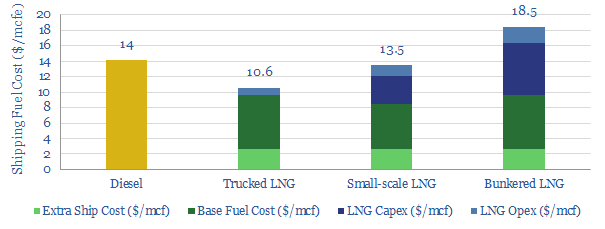
This data-file provides line-by-line cost estimates for LNG as a shipping fuel, for trucked LNG, small-scale LNG and bunkered LNG. After IMO 2020 regulations buoy diesel pricing, it should be economical to fuel newbuild ships with small-scale LNG; and in the US it should be economical to convert pre-existing ships to LNG.
Content by Category
- Batteries (87)
- Biofuels (42)
- Carbon Intensity (49)
- CCS (63)
- CO2 Removals (9)
- Coal (38)
- Company Diligence (92)
- Data Models (824)
- Decarbonization (159)
- Demand (110)
- Digital (58)
- Downstream (44)
- Economic Model (201)
- Energy Efficiency (75)
- Hydrogen (63)
- Industry Data (276)
- LNG (48)
- Materials (81)
- Metals (76)
- Midstream (43)
- Natural Gas (146)
- Nature (76)
- Nuclear (23)
- Oil (163)
- Patents (38)
- Plastics (44)
- Power Grids (124)
- Renewables (149)
- Screen (112)
- Semiconductors (30)
- Shale (51)
- Solar (67)
- Supply-Demand (45)
- Vehicles (90)
- Wind (43)
- Written Research (347)