Search results for: “climate model”
-
Solvent extraction: Rare Earth separations?
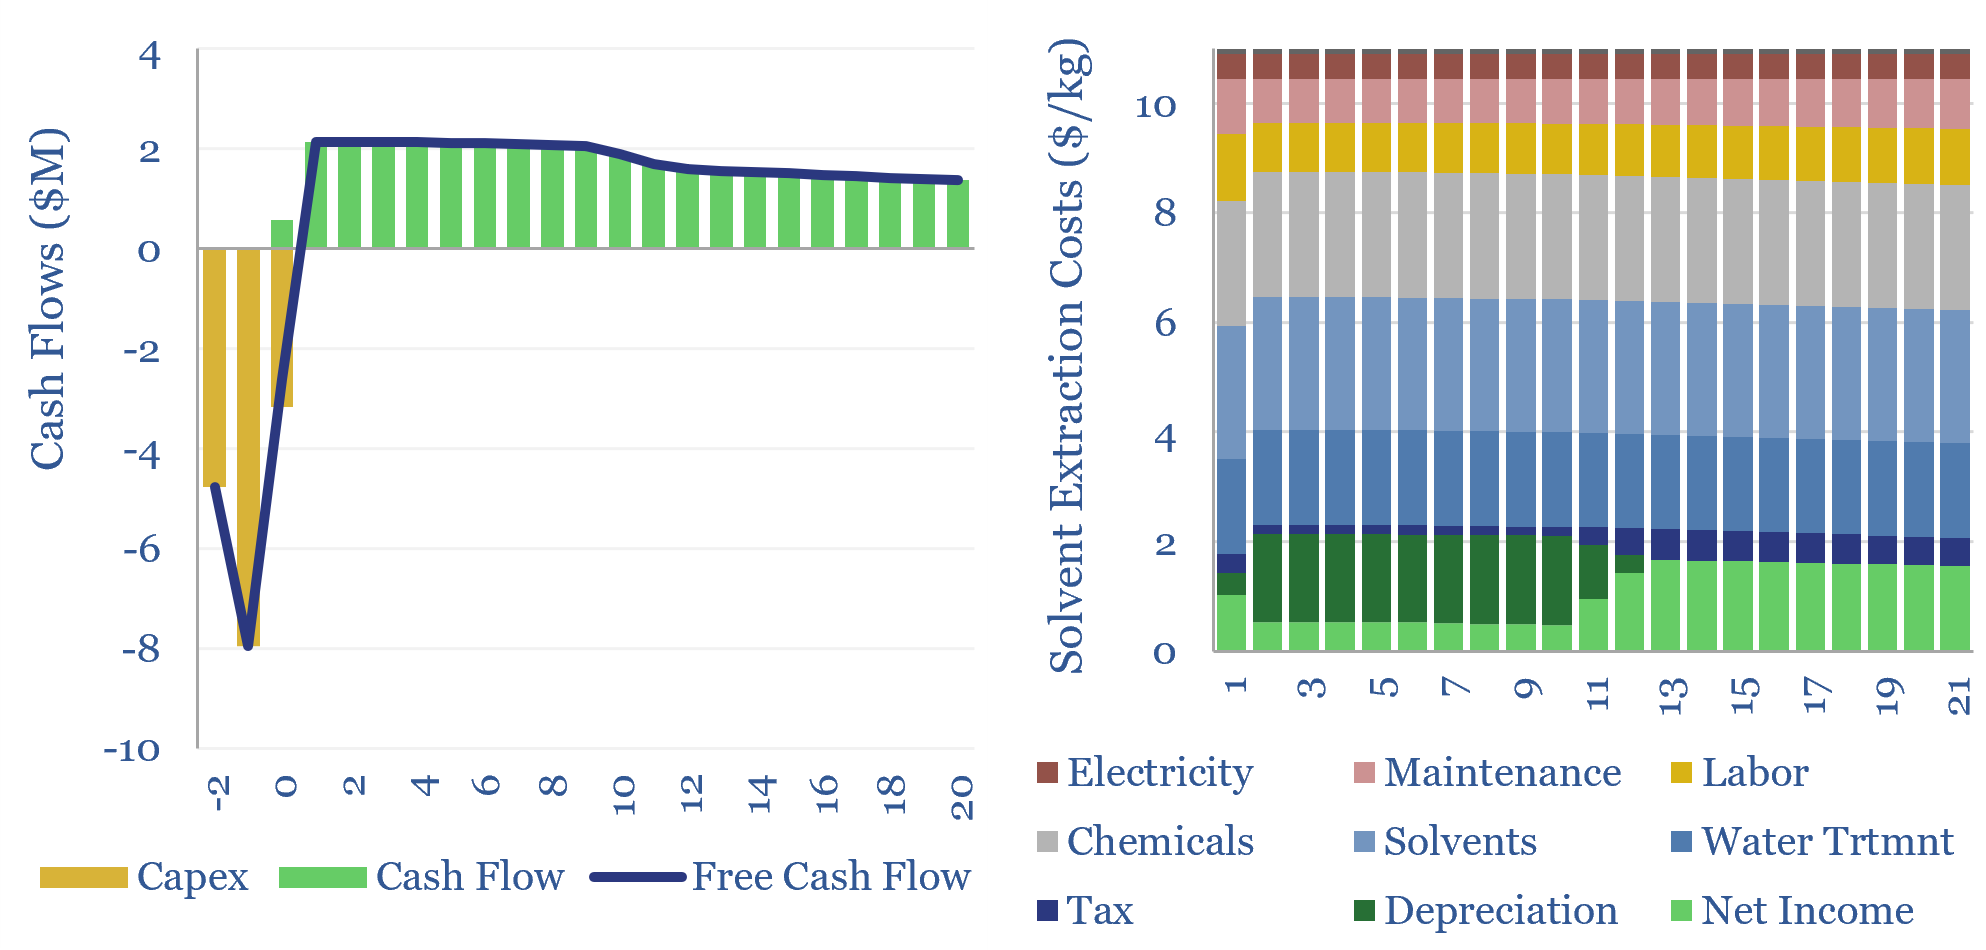
How are Rare Earths separated and concentrated? The process uses solvent extraction in mixer-settlers. It will typically cost over $10/kg, and possibly in the hundreds of dollars per kg. Solvent extraction costs are highly variable and can be stress-tested in this data-file.
-
Economics of flywheels: fast frequency response?
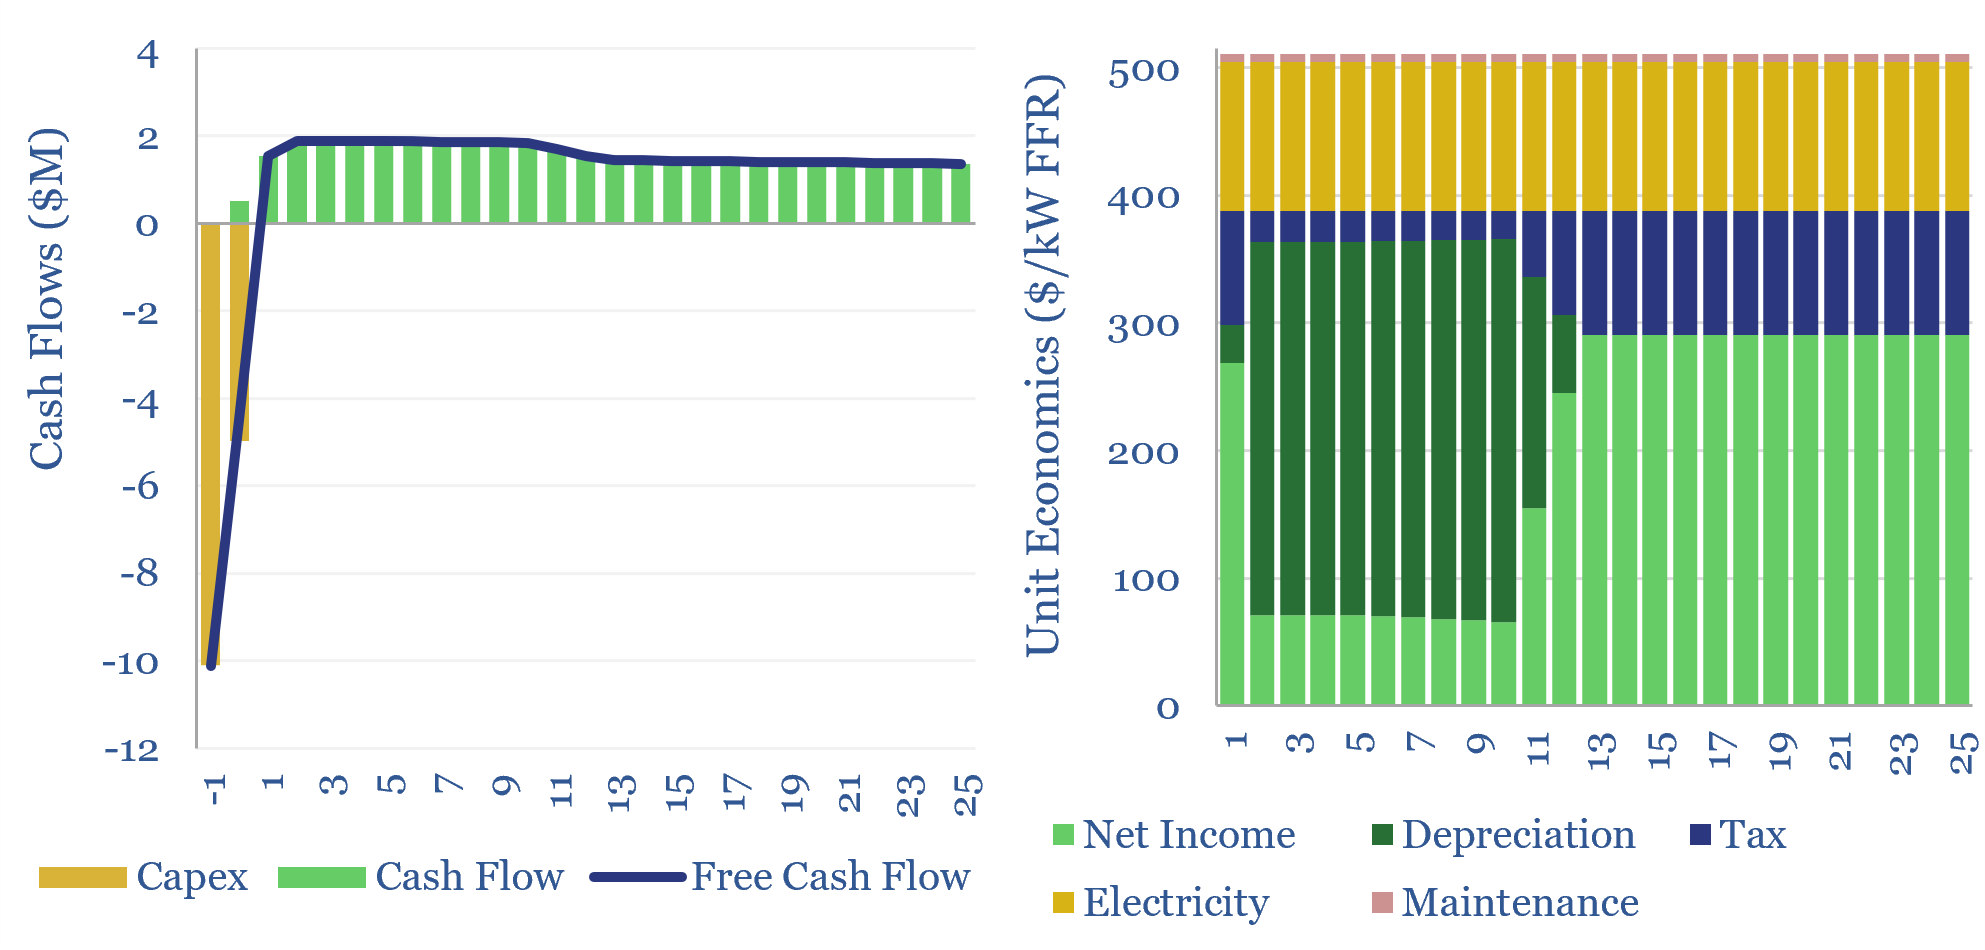
The economics of flywheels can be stress-tested in this data-file, requiring a $500/kW fee for fast-frequency response, to generate a 10% IRR on c$10,000/kWh of capex costs, on a typical flywheel plant with around 15-minutes of energy storage. The rise of renewables and AI increasingly requires adding inertia to power grids. Flywheels may be one…
-
Heavy truck costs: diesel, gas, electric or hydrogen?
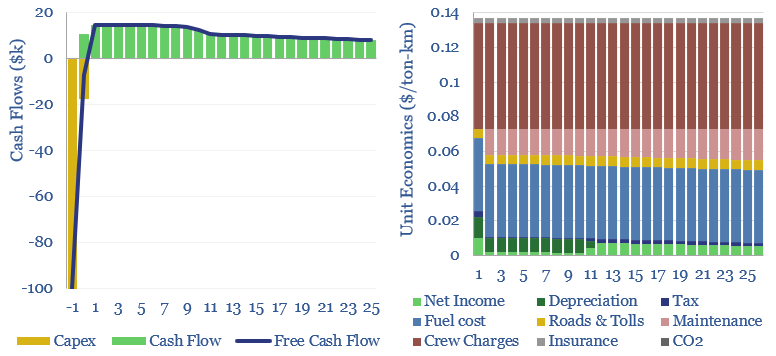
Heavy truck costs are estimated at $0.14 per ton-kilometer, for a truck typically carrying 15 tons of load and traversing over 150,000 miles per annum. Today these trucks consume 10Mbpd of diesel and their costs absorb 4% of post-tax incomes. Electric trucks would be 20-50% most costly, and hydrogen trucks would be 45-75% more, which…
-
Eni Slurry Technology. A leader for IMO 2020?
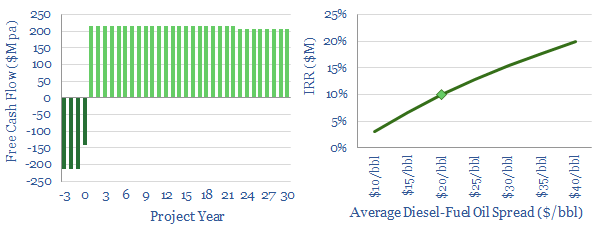
This data-file models the economics of Eni’s Slurry Technology, for hydro-converting heavy crudes and fuel oils into light products. It is among the top technologies we have reviewed for the arrival of IMO 2020 sulfur regulation, achieving >97% conversion of heavy fractions.
-
Wind: aim higher?
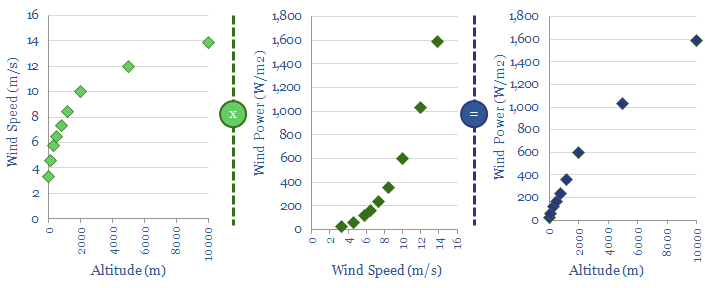
This data-file contains a simple model for how wind speeds and wind power co-vary with altitude. 2x greater power could likely be harnessed by a kite at 300m than a similar-sized turbine at 80m.
-
Thermo-Plastic Composite: The Future of Risers?
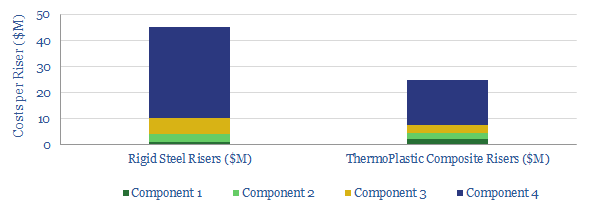
We estimate thermo-plastic composite riser costs line-by-line. Savings should reach 45%. The file also includes a complete history of TCP installations to-date, as this technology’s adoption continues.
-
Machine Learning to Optimise Rod Pumps
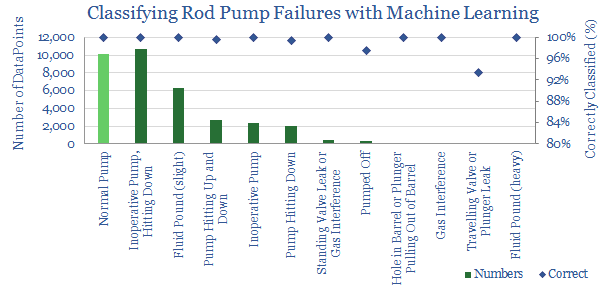
This data-file summarises progress using machine learning to maximise production from mature wells, by detecting errors and optimising production. There is potential to lower global decline rates by c100kbpd per annum for over a decade, and increase each well’s NPV by $0.1M.
-
Shale EOR: the economics
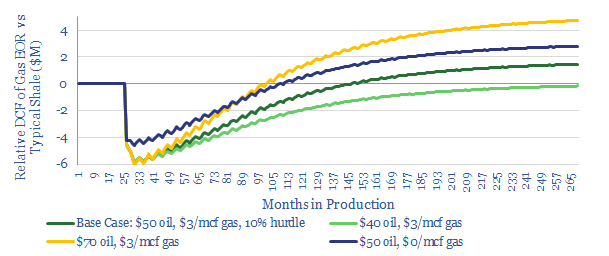
This model assesses shale-EOR economics, as a function of oil prices, gas prices, production-profiles and capex costs. 15-20% IRRs are attainable in our base case. Economics are getting increasingly exciting, as the technology is de-risked and more gas is stranded in key shale basins.
-
Ventures for an Energy Transition?
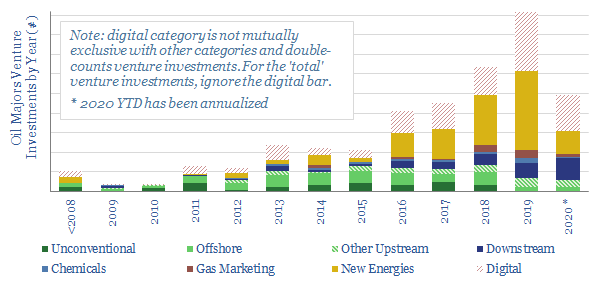
This database tabulates c300 venture investments, made by 9 of the leading Oil Majors. Their strategy is increasingly geared to advancing new energies, digital technologies and improving mobility. Different companies are compared and contrasted, including the full list of venture investments over time.
-
De-Manning Deepwater?
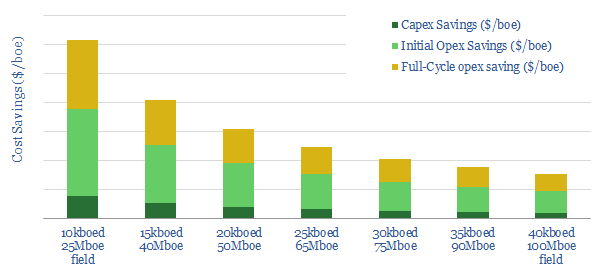
We estimate a typical deepwater oilfield could save $15-20/bbl by “de-manning”, if implemented correctly. This data-file contains our workings, across 15 cost lines, based on recent design work from Technip-FMC.
Content by Category
- Batteries (89)
- Biofuels (44)
- Carbon Intensity (49)
- CCS (63)
- CO2 Removals (9)
- Coal (38)
- Company Diligence (94)
- Data Models (838)
- Decarbonization (160)
- Demand (110)
- Digital (59)
- Downstream (44)
- Economic Model (204)
- Energy Efficiency (75)
- Hydrogen (63)
- Industry Data (279)
- LNG (48)
- Materials (82)
- Metals (80)
- Midstream (43)
- Natural Gas (148)
- Nature (76)
- Nuclear (23)
- Oil (164)
- Patents (38)
- Plastics (44)
- Power Grids (130)
- Renewables (149)
- Screen (117)
- Semiconductors (32)
- Shale (51)
- Solar (68)
- Supply-Demand (45)
- Vehicles (90)
- Wind (44)
- Written Research (354)