Search results for: “climate model”
-
Managed reforestation: growth rates by tree species over time?
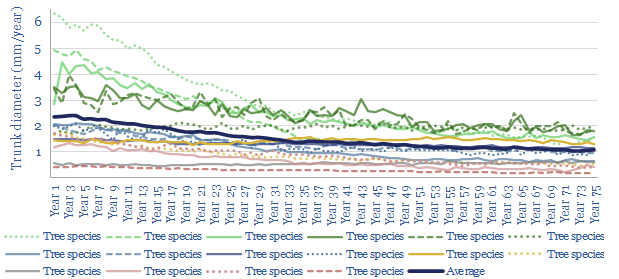
This data-file tabulates the growth rates of 2,500 trees, in 12 different geographies, finding that younger trees accumualate biomass faster than older trees. The average tree widens its radius by 2mm per year. But on average, growth rates slow by c25% after 20-years, c40% after 40-years and 50% after 60-years.
-
Photo opp: reforestation, CO2 fertilization and global temperatures?
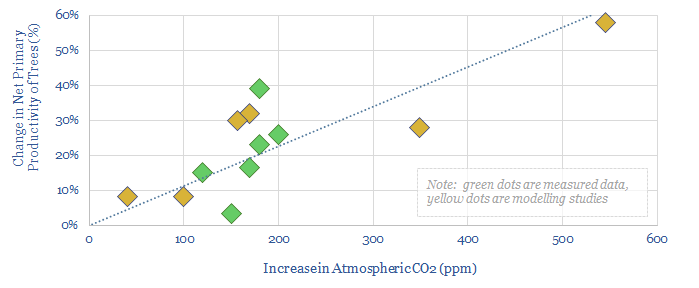
Well-crafted reforestation projects may absorb atmospheric CO2 25% more rapidly than in the past, aligning species and site selection with the world’s changing climate. This work outlines the bio-chemistry of CO2 fertilization and temperature changes on photosynthetic productivity.
-
Reforestation: what planting density for seedlings?
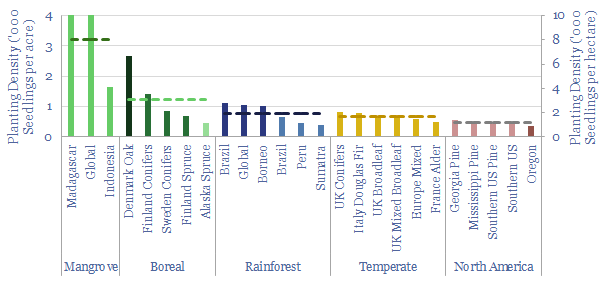
What is the typical planting density for reforestation projects globally? This matters as it can determine the costs of reforestation. Hence in this data-file we have collated data from 25 different case studies globally, which have tended to plant a median of 670 seedlings per acre (1,650 per hectare).
-
Natural gas: the EU green taxonomy’s 270g/kWh CO2 target?
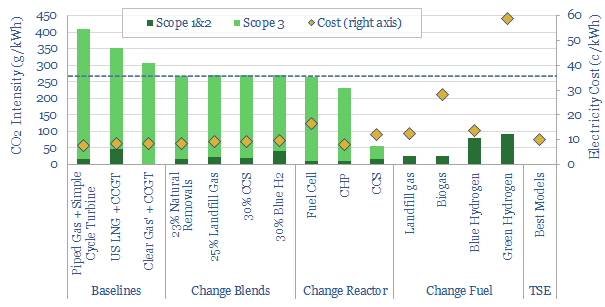
The EU taxonomy is a set of guidelines that label some investments as ‘green’. This includes gas power with a CO2 intensity below 270g/kWh. Most conventional gas projects will not meet this hurdle, but CHPs and 20-30% blends of lower-carbon gas could accelerate.
-
Russia conflict: pain and suffering?
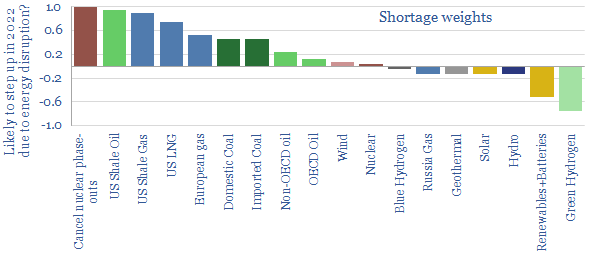
This 13-page note presents 10 hypotheses on Russia’s horrific conflict. Energy supplies will very likely get disrupted, as Putin no longer needs to break the will of Ukraine, but also the West. Results include energy rationing and economic pain. Climate goals get shelved during the war-time scramble. Pragmatism, nuclear and LNG emerge from the ashes.
-
World’s largest energy assets: by category and risk?
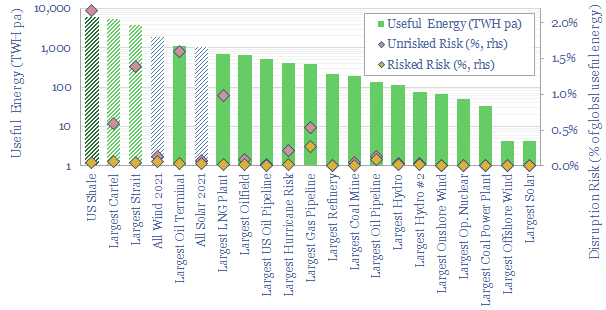
The largest hydrocarbon mega-projects are still 10-25x larger than the world’s largest solar and offshore wind projects. Risks are different in each category. But on a risked basis, global energy supplies may come in c2% lower than base case forecasts
-
Energy security: volcanos versus solar panels?
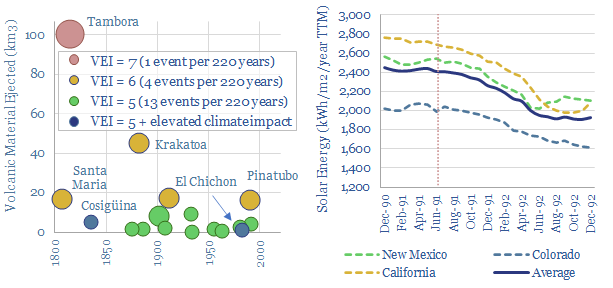
Every 30-years on average, a giant volcano erupts, ejecting >10km3 of debris, including aerosols that dim the sun and temporarily cool the planet by 0.5-1C. After Mount Pinatubo erupted in 1991, US solar insolation fell by 20% in 1992. What implications for global energy security and energy transition?
-
Crop production: how much does nitrogen fertilizer increase yields?
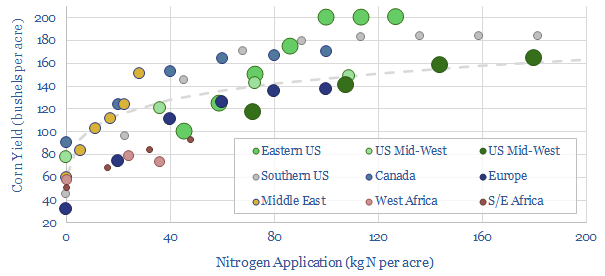
How much does fertilizer increase crop yields? Aggregating all of the global data, a good rule of thumb is that up to 200kg of nitrogen can be applied per acre, increasing corn crop yields from 60 bushels per acre (with no fertilizer) to 160 bushels per acre (at 200 kg/acre). But the relationship is logarithmic,…
-
CH4 context: the largest methane leaks of all time?
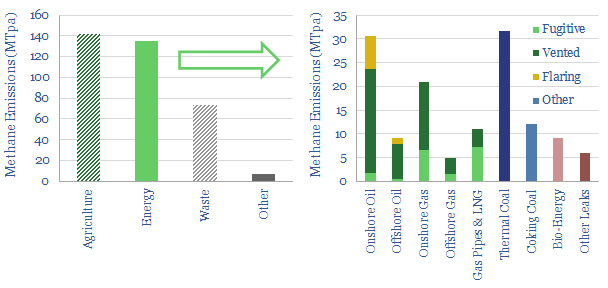
Global methane emissions run to 360MTpa. 40% is agriculture, 40% is the energy industry and 20% is landfills. Within energy, over 30% of the leaks are from coal, 30% are from oil, 27% are from gas. This short note quantifies some of the largest methane leaks of all time, and provides context for the recent…
-
CO2 removals: CO2OL Panama project?
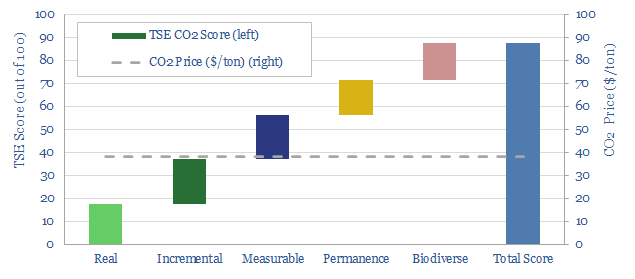
The CO2OL Tropical Mix project has planted 9M trees on 13,000 hectares of degraded pasture land across 45 sites in Panama since 1995. 20-30% of the land is reserved for conservation. The project achieved a relatively high score of 88/100 on our usual assessment framework. CO2 credits are priced at $38/ton. We contributed $1,900 to…
Content by Category
- Batteries (89)
- Biofuels (44)
- Carbon Intensity (49)
- CCS (63)
- CO2 Removals (9)
- Coal (38)
- Company Diligence (95)
- Data Models (840)
- Decarbonization (160)
- Demand (110)
- Digital (60)
- Downstream (44)
- Economic Model (205)
- Energy Efficiency (75)
- Hydrogen (63)
- Industry Data (279)
- LNG (48)
- Materials (82)
- Metals (80)
- Midstream (43)
- Natural Gas (149)
- Nature (76)
- Nuclear (23)
- Oil (164)
- Patents (38)
- Plastics (44)
- Power Grids (131)
- Renewables (149)
- Screen (117)
- Semiconductors (32)
- Shale (51)
- Solar (68)
- Supply-Demand (45)
- Vehicles (90)
- Wind (44)
- Written Research (356)