Search results for: “shale”
-
Flaring reduction: fire extinguishers?
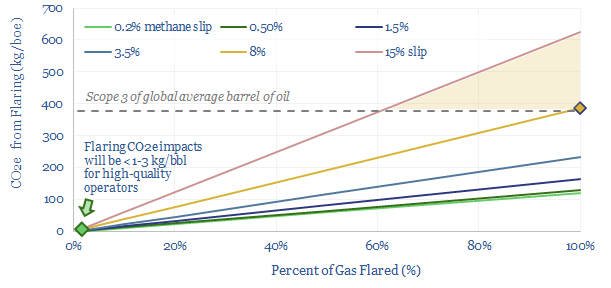
Controversies over oil industry flaring are re-accelerating, especially due to the methane slip from flares, now feared as high as 8% globally. The skew entails that more CO2e could be emitted in producing low quality barrels (Scope 1) than in consuming high quality barrels (Scope 3). Environmental impacts are preventable. This 10-page note explores how,…
-
Dreaming of Electric Frac Fleets?
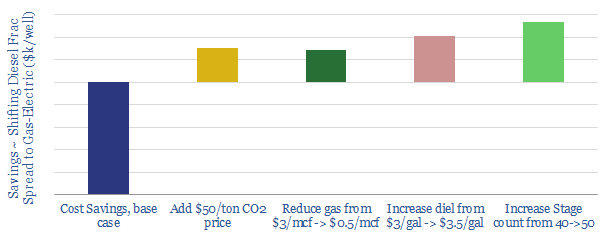
In 2019, the virtues of switching diesel-powered frac fleets to gas-powered electric have been extolled by companies such as EOG, Shell, Baker Hughes, Halliburton, Evolution and US Well Services. The chief benefit is a material cost saving, quantified per well in this data-model, as a function of the frac fleet size, its upgrade costs, its…
-
Why the Thunder Said?
This 8-page report outlines the ‘four goals’ of Thunder Said Energy; and how we hope we can help your process…
-
CO2 Intensity of Oilfield Supply Chains
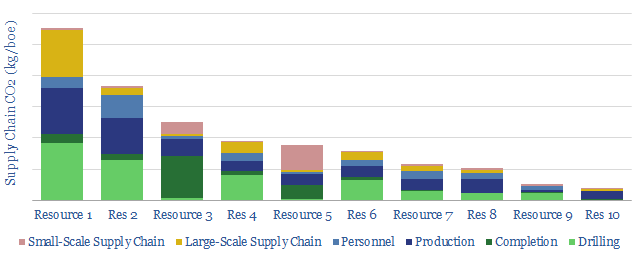
What is more CO2-intensive: the c4,000 truck trips needed to complete a shale well, or giant offshore service vessels (OSVs), which each consume >100bpd of fuel? This data-file quantifies the CO2 intensity of supply-chains, for 10 different resource types, as a function of 30 input variables.
-
EOG’s Digitization: Pumped-Up?
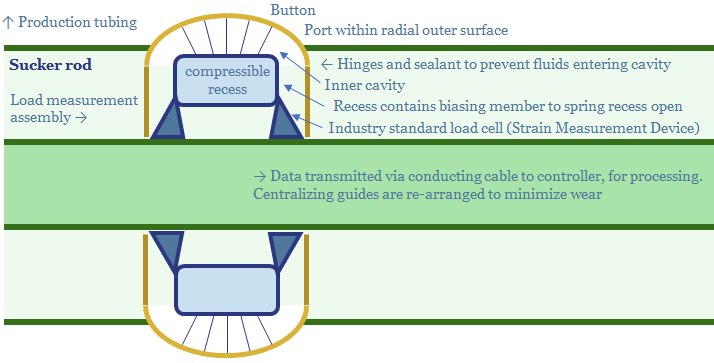
EOG patented a new digital technology in 2019: a load assembly which can be built into its rod pumps: to raise efficiency, lower costs and lower energy consumption (i.e., CO2). This short note reviews the patent, illustrating how EOG is working to further digitize its processes, maximise productivity and minimise CO2 intensity.
-
Ten Themes for Energy in 2020
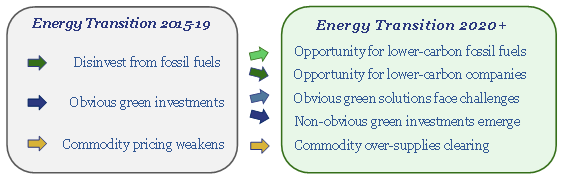
Energy transition is maturing as an investment theme. ‘Obvious’ portfolio tilts are beginning to look over-crowded. Non-obvious ones are looking over-looked. This note outlines the ‘top ten’ themes that excite us most in 2020, among commodities, drivers of the energy transition, market perceptions and corporate strategies.
-
US CO2 and Methane Intensity by Basin
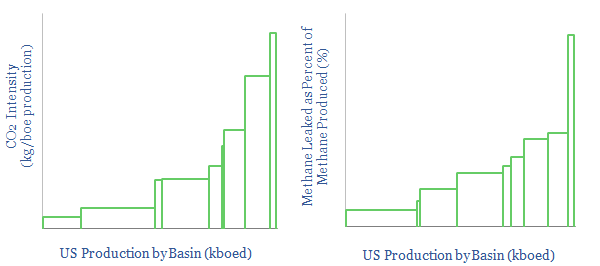
The CO2 intensity of oil and gas production is tabulated for 425 distinct company positions across 12 distinct US onshore basins in this data-file. Using the data, we can aggregate the total upstream CO2 intensity in (kg/boe), methane leakage rates (%) and flaring intensity (in mcf/boe), by company, by basin and across the US Lower 48.
-
Fugitive methane: what components are leaking?
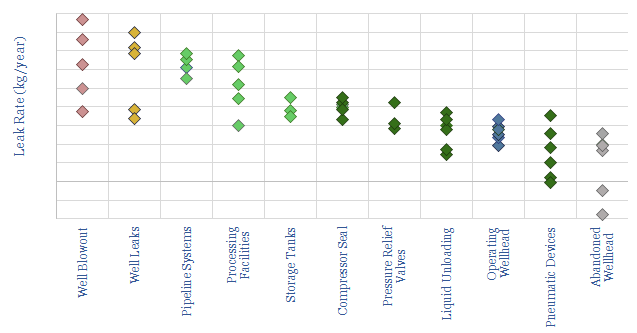
This data-file looks through 35 technical papers to tabulate methane leaks from different components around the oil and gas industry. The largest are losses of well control (up to 1MTpa), then mid-downstream facilities (up to 10kTpa), compressors (up to 100T), pneumatic devices, wellheads and liquid unloading (up to 10T).
-
Energy Transition Technologies?
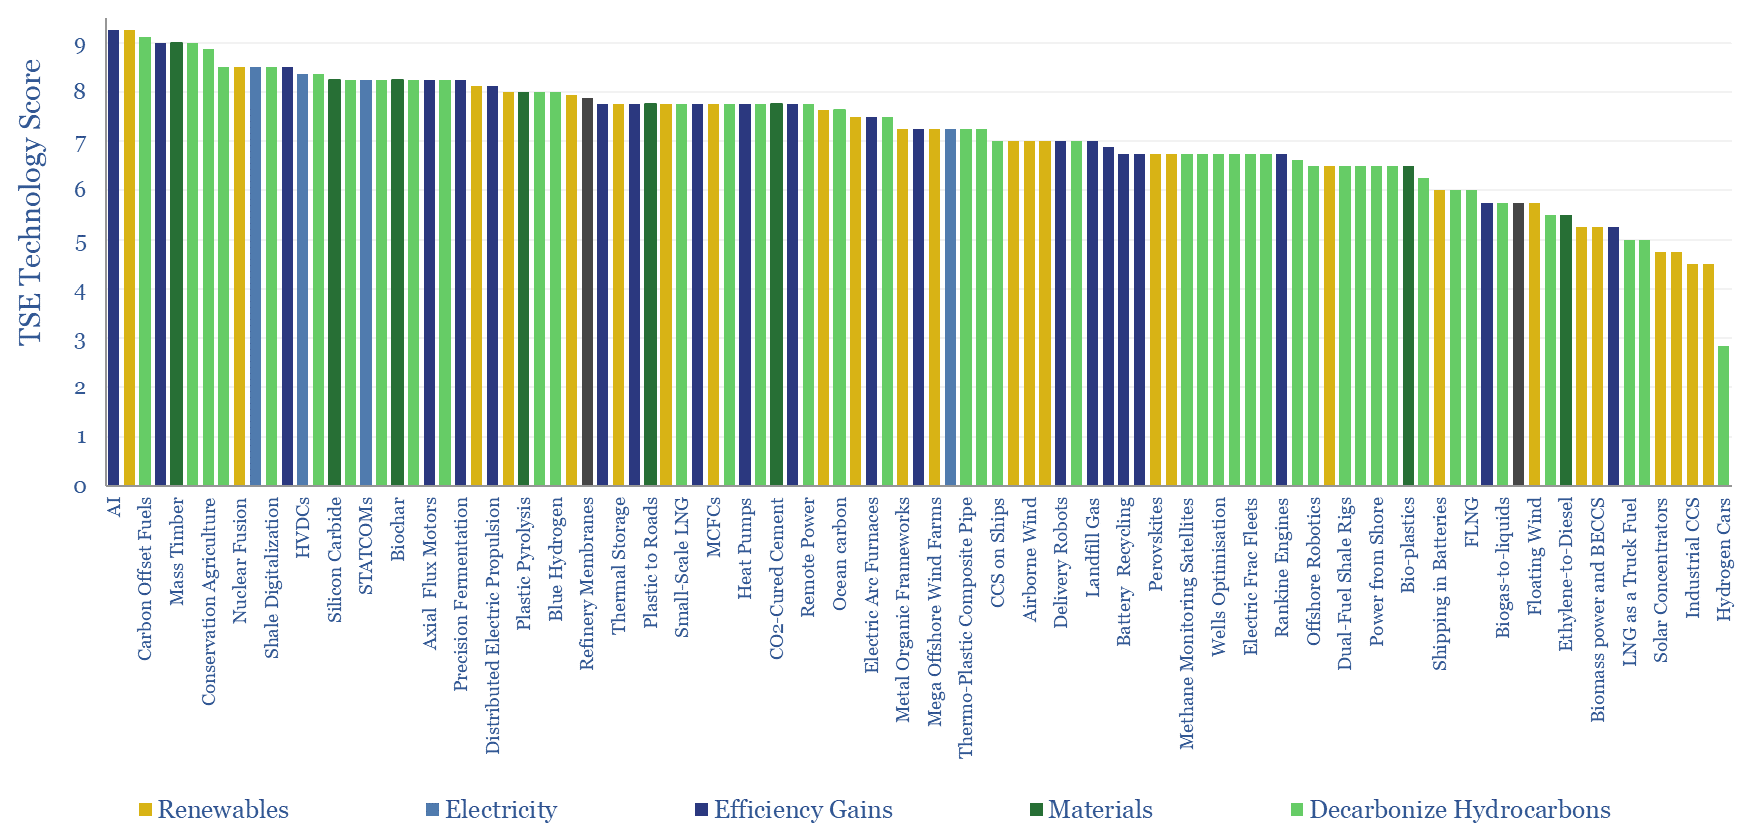
This data-file “scores” the top technologies to transform the global energy industry and the world, as assessed by Thunder Said Energy. Each one is scored based on technical readiness, economic impact and the level of work we have conducted.
-
Permian CO2 Emissions by Producer
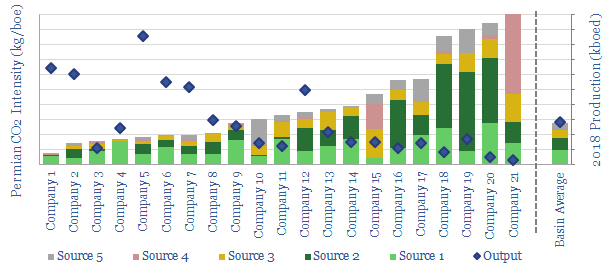
This data-file tabulates Permian CO2 intensity, based on regulatory disclosures from 20 of the leading producers to the EPA. The data are disaggregated by company, across 18 different categories, such as combustion, flaring, venting, pneumatics, storage tanks and methane leaks. There are opportunities to lower emissions.
Content by Category
- Batteries (89)
- Biofuels (44)
- Carbon Intensity (49)
- CCS (63)
- CO2 Removals (9)
- Coal (38)
- Company Diligence (95)
- Data Models (839)
- Decarbonization (160)
- Demand (110)
- Digital (60)
- Downstream (44)
- Economic Model (204)
- Energy Efficiency (75)
- Hydrogen (63)
- Industry Data (279)
- LNG (48)
- Materials (82)
- Metals (80)
- Midstream (43)
- Natural Gas (148)
- Nature (76)
- Nuclear (23)
- Oil (164)
- Patents (38)
- Plastics (44)
- Power Grids (130)
- Renewables (149)
- Screen (117)
- Semiconductors (32)
- Shale (51)
- Solar (68)
- Supply-Demand (45)
- Vehicles (90)
- Wind (44)
- Written Research (354)