Search results for: “volatility”
-
Energy market volatility: climate change?
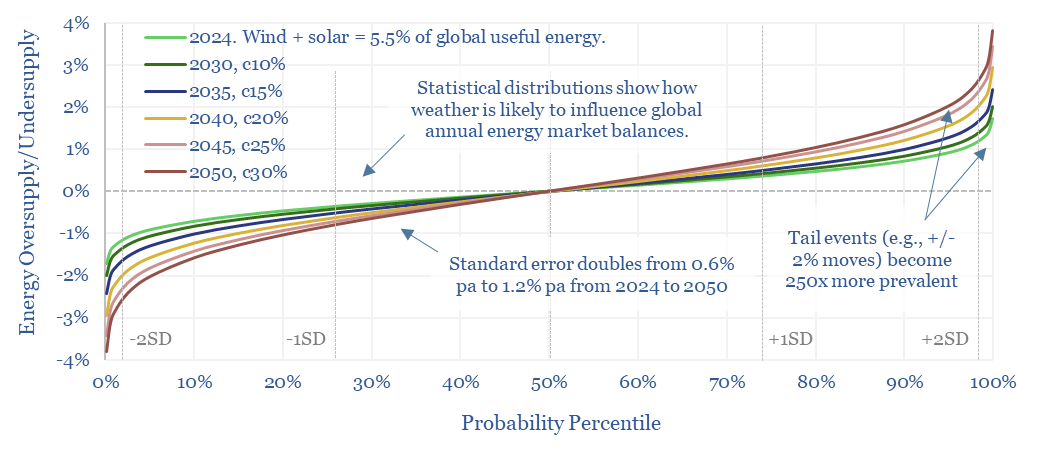
This 14-page note predicts a staggering increase in global energy market volatility, which doubles by 2050, while extreme events that sway energy balances by +/- 2% will become 250x more frequent. A key reason is that the annual output from wind, solar and hydro all vary by +/- 3-5% each year, while wind and solar…
-
Oil markets: rising volatility?
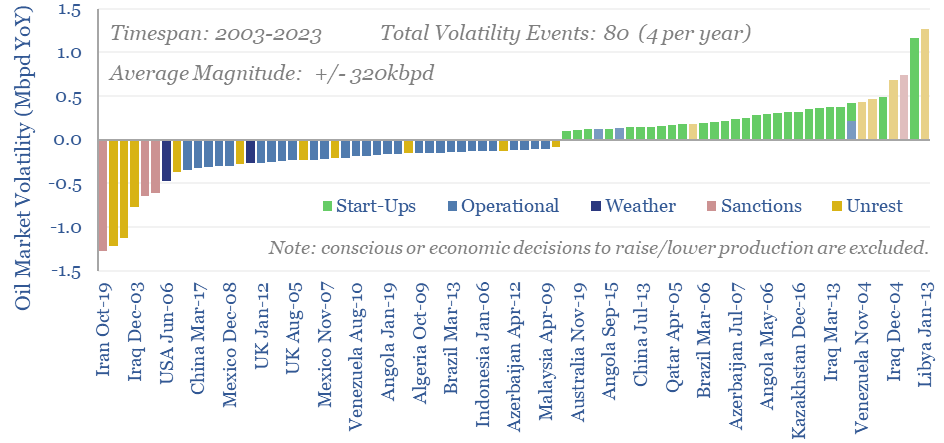
Oil markets endure 4 major volatility events per year, with a magnitude of +/- 320kbpd, on average. Their net impact detracts -100kbpd. OPEC and shale have historically buffered out the volatility, so annual oil output is 70% less volatile than renewables’ output. This 10-page note explores the numbers and the changes that lie ahead?
-
Solar volatility: interconnectors versus batteries?
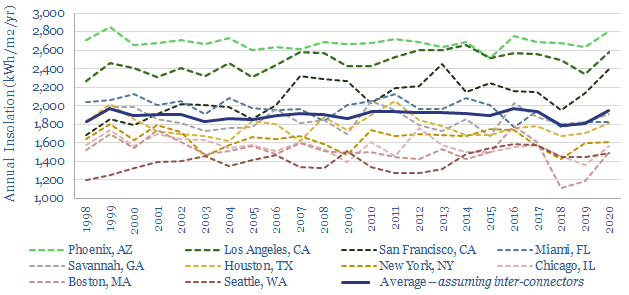
The solar energy reaching a given point on Earth’s surface varies by +/- 6% each year. These annual fluctuations are 96% correlated over tens of miles. And no battery can economically smooth them. Solar heavy grids may thus become prone to unbearable volatility. Our 17-page note outlines this important challenge, and finds that the best…
-
Prevailing wind: new opportunities in grid volatility?
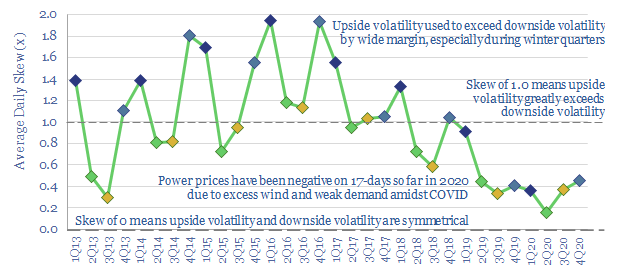
UK wind power has almost trebled since 2016. But its output is volatile, now varying between 0-50% of the total grid. Hence this 14-page note assesses the volatility, using granular, hour-by-hour data from 2020, to outline which backup opportunities are best-placed.
-
Energy trading: value in volatility?
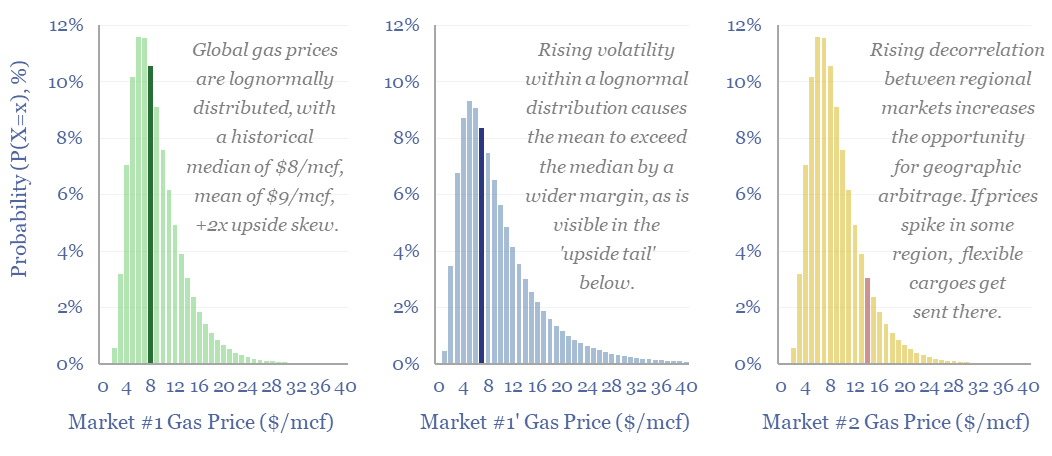
Could renewables increase hydrocarbon realizations? Or possibly even double the value in flexible LNG portfolios? Our reasoning in this 14-page report includes rising regional arbitrages, and growing volatility amidst lognormal price distributions (i.e., prices deviate more to the upside than the downside). What implications and who benefits?
-
Sugar to ethanol: value in volatility?
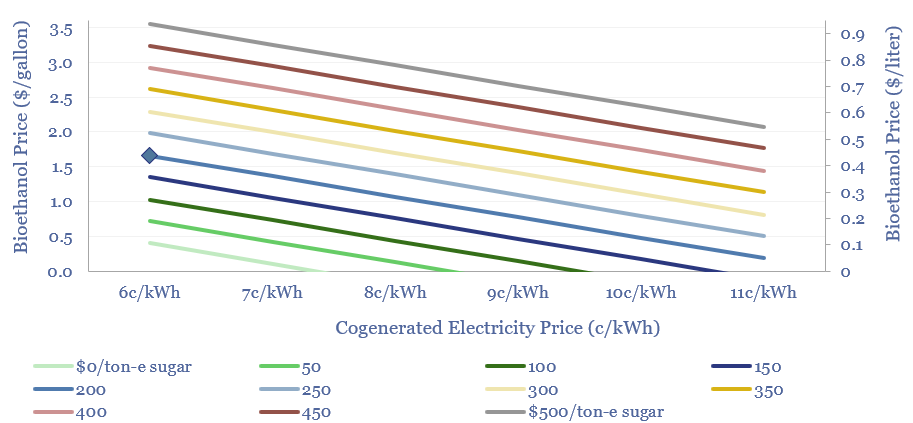
Sugar cane is an amazing energy crop, yielding 70 tons per hectare per year, of which 10-15% is sugar and 20-25% is bagasse. Crushing facilities create value from sugar, sugar-to-ethanol and cogenerated power. This 11-page note argues that more volatile electricity prices could halve ethanol costs or raise cash margins by 2-4x.
-
Supercapacitors: case studies for renewable-heavy grids?
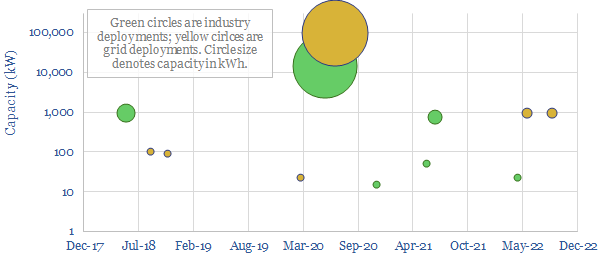
Supercapacitors are well suited to smoothing short-term volatility in increasingly renewables-heavy grids. Typical systems are 10kW-10MW, 1M chage-discharge cycles, 5-30 seconds storage and $30/kW costs. Expect the market to surprise to the upside, especially in combination with other power-electronics. Who benefits?
-
Midstream opportunities in the energy transition?
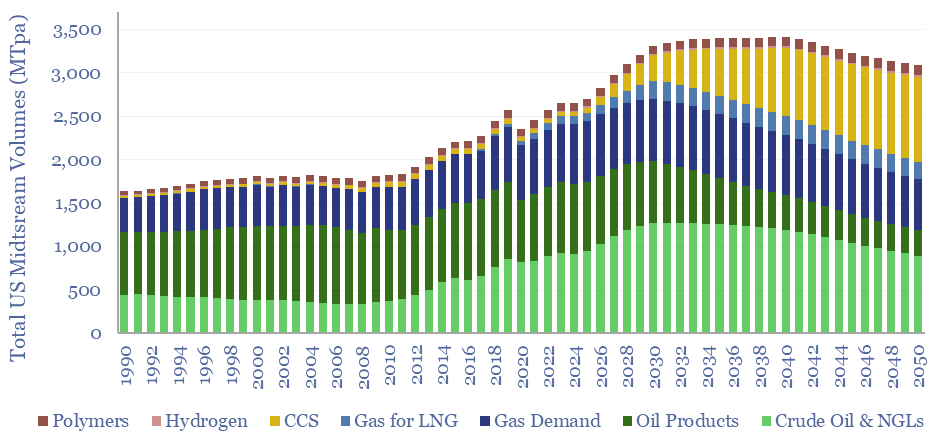
The midstream industry moves molecules, especially energy-molecules, and especially in pipelines. Despite the mega-trend of electrification, there are still strong midstream opportunities in the energy transition, backstopping volatility and moving new molecules. This short note captures our top ten conclusions. (1) Our overall outlook on the US midstream industry sees the total tonnage of molecules…
-
Global oil production by country?
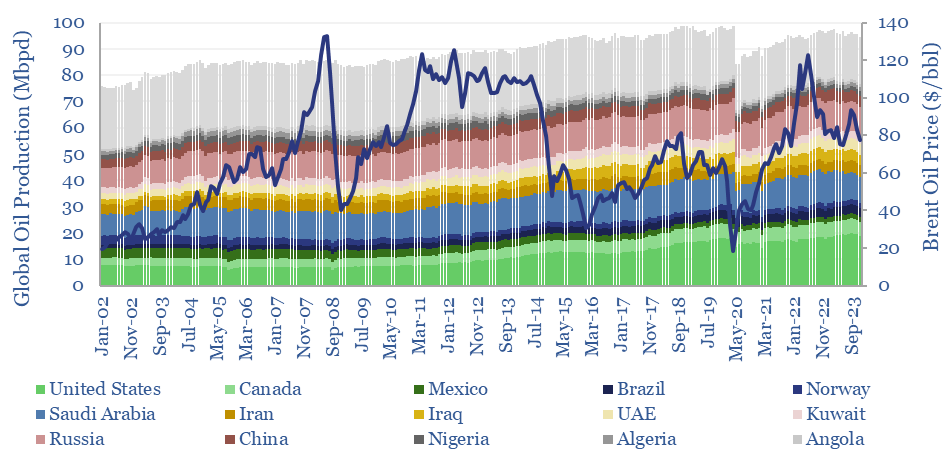
Global oil production by country by month is aggregated across 35 countries that produce 80kbpd of crude, NGLs and condensate, explaining >96% of the global oil market. Production has grown by +1Mbpd/year in the past two-decades, led by the US, Iraq, Russia, Canada. Oil market volatility is usually low, at +/- 1.5% per year, of…
-
Overview of inertia in renewable-heavy grids?
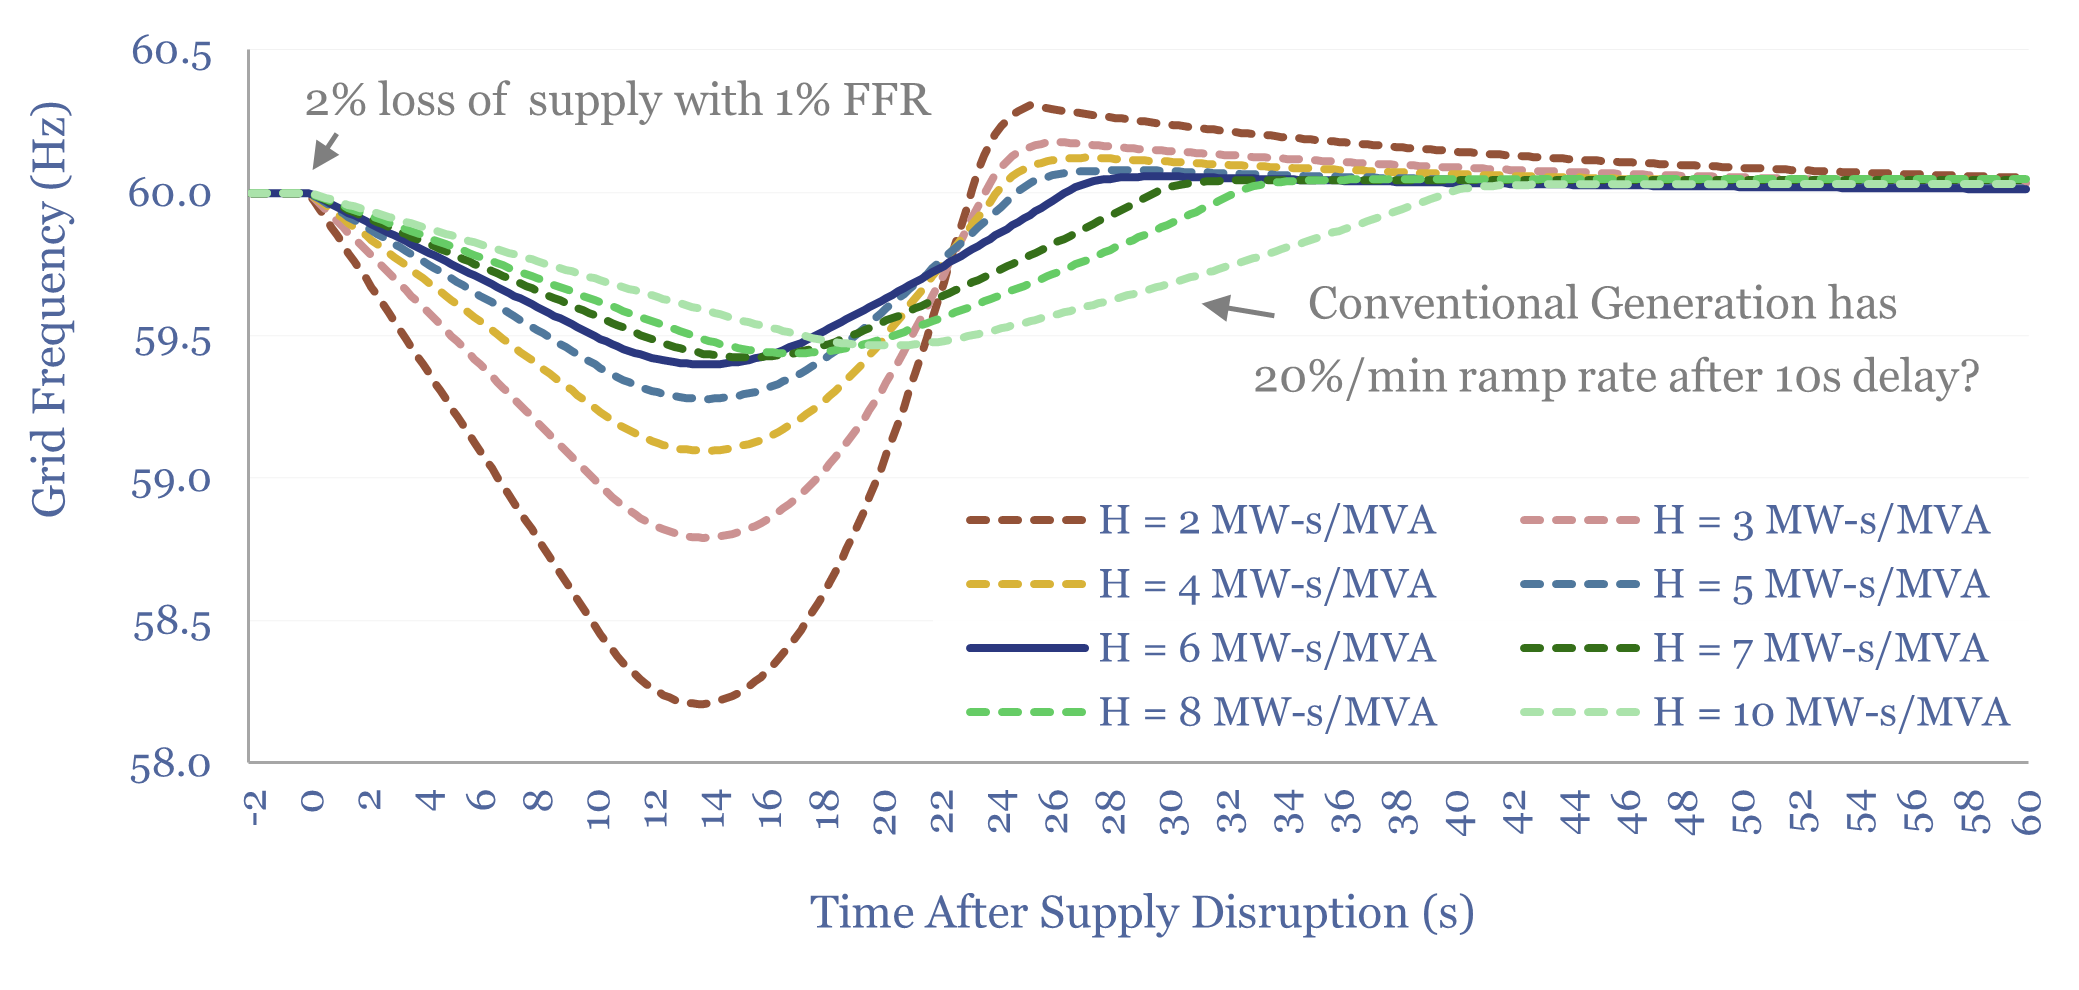
This overview of inertia in renewable-heavy grids tabulates the typical inertia of rotating generators, then models the resultant Rate of Change of Frequency (ROCOF) during supply disruptions. In our base case, a grid with 6 MW-s/MVA of inertia rides through a 2% supply-disruption, buffered by 1% fast frequency response (FFR), via lowering grid frequency from…
Content by Category
- Batteries (89)
- Biofuels (44)
- Carbon Intensity (49)
- CCS (63)
- CO2 Removals (9)
- Coal (38)
- Company Diligence (95)
- Data Models (840)
- Decarbonization (160)
- Demand (110)
- Digital (60)
- Downstream (44)
- Economic Model (205)
- Energy Efficiency (75)
- Hydrogen (63)
- Industry Data (279)
- LNG (48)
- Materials (82)
- Metals (80)
- Midstream (43)
- Natural Gas (149)
- Nature (76)
- Nuclear (23)
- Oil (164)
- Patents (38)
- Plastics (44)
- Power Grids (130)
- Renewables (149)
- Screen (117)
- Semiconductors (32)
- Shale (51)
- Solar (68)
- Supply-Demand (45)
- Vehicles (90)
- Wind (44)
- Written Research (354)