Biomass and BECCS: what future in the transition?
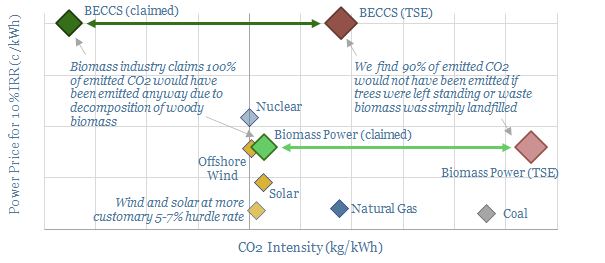
Biomass and BECCS

20% of Europeโ€™s renewable electricity currently comes from biomass, mainly wood pellets, burned in facilities such as Draxโ€™s 2.6GW Yorkshire plant. But what are the economics and prospects for biomass power as the energy transition evolves? This 18-page analysis leaves us cautious.


Arguments in favor of biomass are outlined on pages 2-3, using the carbon cycle to show how biomass could be considered zero-carbon in principle.

Examples of biomass power plants are described on pages 4-5, focusing upon Drax and RWE, and drawing upon data from 340 woody biomass facilities in US power.

The economics of producing biomass pellets are presented on pages 6-7, including a detailed description, capex breakdown, and critique of input assumptions.

The economics of burning biomass pellets to generate electricity are presented on pages 8-9, again with a detailed description and critique of input assumptions.

The economics of capturing and disposing of the CO2 are presented on pages 10-12, allowing us to build up a full end-to-end abatement cost for BECCS.

Energy economics are disaggregated on pages 13-14, in order to derive a measure of energy return on energy invested (EROEI) and CO2 intensity (in kg/kWh). Surprisingly, we find the EROEI for BECCS to be negative.

Is it sustainable? We answer this question on 15-17, arguing that biomass energy and BEECS, properly considered, both have a higher CO2 intensity than gas.

Conclusions and implications are presented on pages 18, including bridges for the total CO2 intensity of biomass and BECCS.

Decarbonized power: how much wind and solar fit the optimal grid?
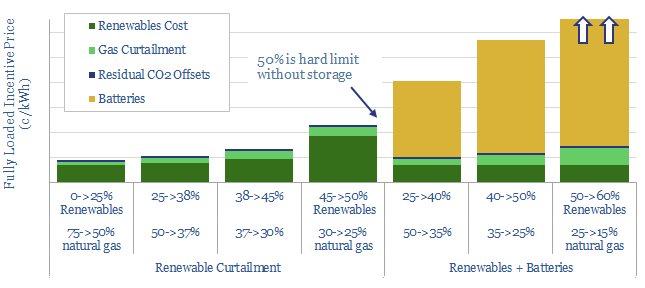
when will wind and solar peak?

What should future power grids look like? Our 24-page note optimizes cost, resiliency and CO2, using a Monte Carlo model. Renewables should not surpass 45-50%. By this point, over 70% of new wind and solar will fail to dispatch, while incentive prices will have trebled. Batteries help little. They raise power prices by a further 2-5x to accommodate just 3-15% more renewables. The lowest-cost, zero-carbon power grid, we find, comprises c25% renewables, c25% nuclear and c50% decarbonized gas, with an incentive price of 9c/kWh.


Pages 2-4 illustrate the volatility of wind and solar generation at today’s grid penetration, providing rules of thumb around intermittency.

Pages 5-6 illustrate the strange consequences once renewables surpass 25% of the grid, including curtailment, negative power pricing and financing difficulties.

Pages 7-9 quantify and explain how much curtailment will take place in a typical grid as renewables scale from 25% to 40%, 50% and 60% of gross generation, using a Monte Carlo approach. The model shows when and why curtailment is occurring.

Pages 10-20 quantify and explain the costs of batteries, to backstop renewables as they scale from 25%, to 40%, 50% and 60% of the grid, while avoiding curtailment. Real world conditions are not conducive to competitive battery economics.

Pages 21-23 quantify the residual reliance on natural gas. Amazingly, even our most aggressive battery scenarios only permit 10% of gas-power capacity to be shuttered. Low-utilization gas is costly. High-utilization gas is less costly. And the economics of decarbonized gas are superior to any renewables plus batteries combination.

Page 24 concludes that natural gas will emerge as the ‘best battery’ to backstop renewables, estimating the most likely shares in an optimal power mix.

Copyright: Thunder Said Energy, 2019-2024.