Satellite-based analysis is gaining momentum, and features in three of our recent research reports. A step-change in resolution is helping to mitigate methane leaks and scale up low-carbon gas. It is possible to track Permian completion activity from space. We also suspect renewable growth may slow, as small-scale solar brings heartland markets closer to saturation. Satellite images should continue finding its way into commercial research, as data improves and costs deflate.
The Spy Who Loved Methane
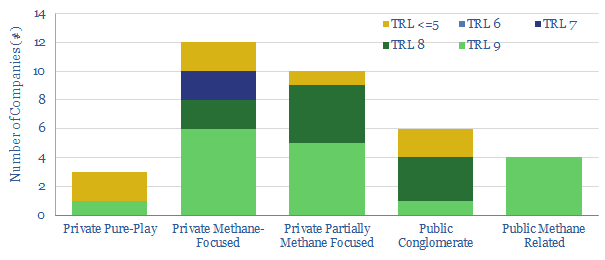
If 3.5% of natural gas is “leaked” as it is commercialised, then it is debatable that natural gas may be a ‘dirtier’ fuel than coal, because methane causes 25-120x more radiative forcing than CO2. Hence it is crucial for the scale up of natural gas – and for the energy transition – that methane leaks are mitigated. Our recent note, ‘Catch Methane if you Can‘ outlined five breakthrough technologies to help, based on screening 34 companies and 150 patents (chart below).
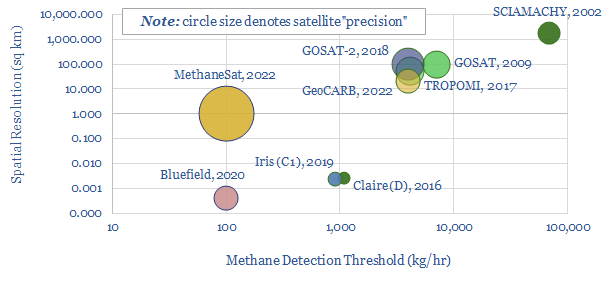
Satellites were among the breakthrough technologies, with the capability to find methane leaks from space. This matters as c5% of super-emitting leaks comprise c50% of leaked methane volumes. But pinpointing these leaks – and who is reponsible for them – has not previously been possible. The current satellites in orbit have had spatial resolutions of 50-100 sq km and detection thresholds of 4-7Tons/hour. By 2022, this will improve to <1sq km spatial resolutions and c100kg/hour. Full details are contained in the note and data-file.
Tracking Shale Completions from Space?
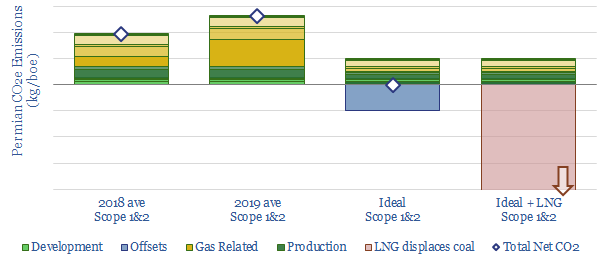
Another debate in 2020 is whether the shale industry is slowing down, in activity terms, in productivity terms, or whether it is staring to re-accelerate. Based on reviewing 650 recent technical papers, we know the best companies are continuing to improve underlying productivity; while they can also re-attract capital and growth by touting low carbon credentials, with some ever potentially becoming “carbon neutral” .
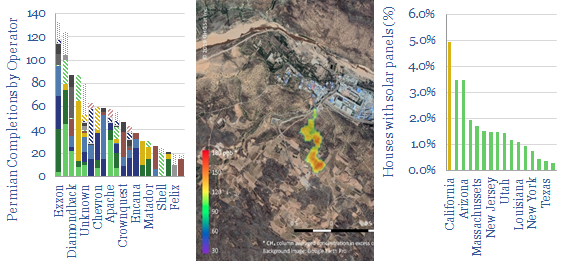
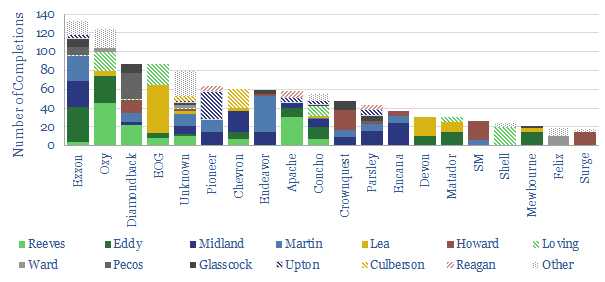
Satellite imagery shows how the industry is consolidating. Below, using data from Terrabotics, we can count the number of completions in the Permian, by operator and by county, in 3Q19. The ‘Top 10’ companies now comprise half of all completion activity. For an introduction to Terrabotics, and their data, please contact us.
Renewables slow-down: Could it be soooner?
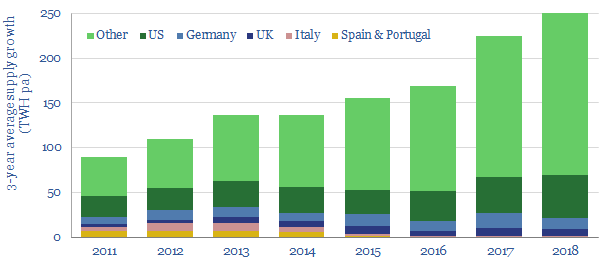
Another theme for 2020 is whether renewables growth will slow down, as heartland markets reach grid saturation. This was the precedent when Spain and Portugal reached 25% penetration of renewables in their grids. The UK, Germany and California could follow suit this year, as explored in detail here.
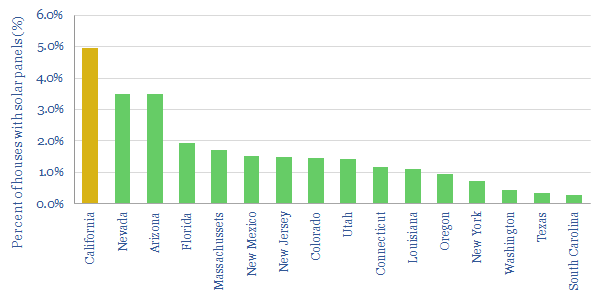
What is not quantified in our data-set of large-scale utility plants is small scale renewable penetration, such as rooftop solar. However, satellite are also starting to unearth these smaller-scale systems, finding them to be more extensive than expected. For example, Stanford’s “Deep Solar” project, has used machine learning to identify over 1.5M solar installations from 1bn satellite images. 5% of houses in California are found to have rooftop solar systems, suggesting renewables are even closer to their threshold.
How do you use satellites in your process?
We are incorporating satellite imagery into more of our research, as evidenced by the three examples above. We write about technologies in the energy space, but these technologies are also changing the commercial research space. We would be very interested to hear from you, if you have observations on the topic, or would like to discuss useful data sources.