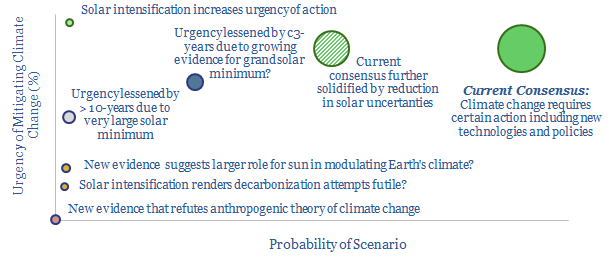
The scientific evidence for anthropogenic climate change is extremely robust, based on the technical papers we have reviewed, warranting better technologies that can decarbonize the global energy system. But the largest uncertainty is our understanding of the sun. Two new satellites (launched in 2018 and 2020) could soon provide unprecedented new data. It is interesting to consider scenarios for how the science could unfold, and how this could alter policies and market sentiment (chart above).
Introduction: Why the Sun Matters?
Much climate science is clear and uncontraversial, making it important to decarbonize the global energy system via better energy technologies. These scientific findings are a guiding reason for our research at Thunder Said Energy.
- Around 1,361 watts per square meter (Wm-2) of solar radiation reaches the Earth’s atmosphere.
- Around 29% is reflected, 23% is absorbed in the atmosphere and 48% is absorbed at the surface.
- CO2 is a greenhouse gas, increasing the portion of solar radiation that is absorbed in th atmosphere.
- At its 1980 concentration level, of 330ppm, CO2 was contributing 1.0 Wm-2 more ‘radiative forcing’ than in 1750. At its 2020 concentration, above 410 ppm, it will be contributing 2.0 Wm-2 more radiative forcing than in 1750.
- CO2 concentrations correlate closely with indisputable rises in global average temperatures, which have increased by around 0.7-1.0C from pre-industrial times, and at an unusually rapid pace.
- The historical precedent is that small changes in climate can instigate large, unpredictable feedback loops.
- Small changes in climate can have large socio-economic consequences.
- Mass extinctions at the ends of Ordivician period (443 million years ago), late Devonian (375mya), Permian (250-260mya) and Triassic (201mya) were all instigated by major climatic changes, killing off 75-96% of life on Earth.
- Better energy technologies, which earn strong returns, are worthwhile whether you believe in climate science or not.
But the role of the sun is much less certain, in our view. The uncertainty makes it harder to model and precisely plan for climate change. It provides a last resort argument for climate skeptics. And long-term solar cycles may sway the sentiment around climate change.
What we know, and what we don’t know, about the sun
The sun undergoes an 11-year sunspot cycle. Specifically, sunspots are dark areas on the solar disc (each tens of thousands of km long, lasting half-a-year), characterized by a strong magnetic field, and associated with warmer solar conditions. Every 11-years, the frequency of sunspots flares up and dies down, causing c1% fluctuation in solar radiation (1.3Wm-2). Each sunspot cycle begins most intensely at the poles and ends most intensely at the sun’s equator (chart below). After each 11-year cycle, the sun’s magnetism mysteriously reverses: North becomes South and South becomes North. Solar cycle 24 began in 2008 and ends in 2020.
Solar cycles have been getting weaker, with each cycle since 1980, which is another mystery. Solar Cycle 24, ending in 2020, has seen the fewest sunspots in at least 200-years (chart here). Solar Cycle 25 is predicted to be even weaker. This has led some scientists to worry that a ‘grand solar minmum’ (GSM) could be imminent…
Grand solar minima. Longer term data on the sun are not directly available, but can be inferred from the studies of isotopes in ice cores or rocks. These data imply the sun spends around one-sixth of its time in a quiet state called a ‘Grand Solar Minimum’ (GSM). 15-25 grand minima have been identified over the past 11,000 years, lasting 70-years on average. Minima and related solar effects have been posited among the triggers of Ice Ages, every 40-100k years since the start of the Pleisocene, 2.6mya. The causes and impacts of these minima are unclear.
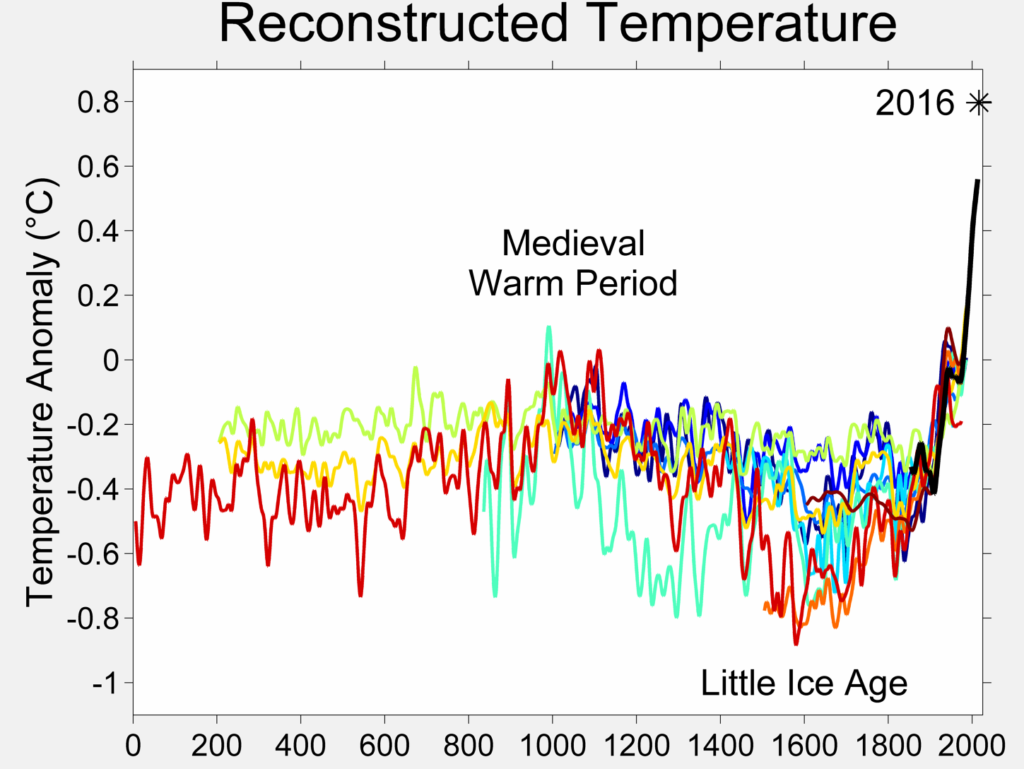
The Maunder Minimum, most famously, was a c50-year period from about 1650-1700 “when sunspots vanished, for reasons which are not yet fully understood” (Meehl et al, 2013), contributing to a ‘Little Ice Age’. Temperatures fell 0.2-1.0C below the medieval warm period (chart below). Other reconstructions, which are not shown below, have estimated a difference of as much as 2C, and others of almost zero.
We may be going into a minimum. One study notes from cosmogenic isotopes that “in recent decades the Sun has been in a Grand Solar Maximum (GSM) which has lasted longer than all others in the past 9.3 millennia and is expected to end soon” (Barnard et al, 2011). Another study uses a fully coupled climate model to predict 0.25C cooling from a grand solar minimum, between 2020 and 2070 (Meehl et al, 2013). Papers cited by NASA give a similar estimate, around 0.3C.
There are limited data on longer-term solar cycles. Direct solar measurements via satellite started only in 1978. Routine photographs of the sun have been taken since 1876. Direct temperature records are available since 1850. Observations of sunspots go back c400-years, when telescopes were invented. But all of our longer-term data is inferred from proxy measures.
Some studies postulate even longer-term cycles. In addition to a 350-400 year grand cycle, Zharkova et al (2019) posit a ‘super-grand cycle’ of c2,000 years, troughing in c1600, governed by inertial motion of the solar dynamo, around the ‘barycenter of the solar system’. As we are now 350-400 years on from the Maunder Minimum, another GSM is seen denting temperatures in 2020-2050. But even more alarmingly, the upswing of the longer and larger 2,000 year cycle is then seen causing 1.3C further warming by 2100 and 2.5C further warming by 2600.
No one fully understands these long-term solar cycles. Zharkova’s paper, quoted above, is widely criticized for mistaken assertions about the distances betwen Sun and Earth. Others speculate whether these long-term cycles are random, or modulated by the orbits of planets, the rotation of the sun, or something else.
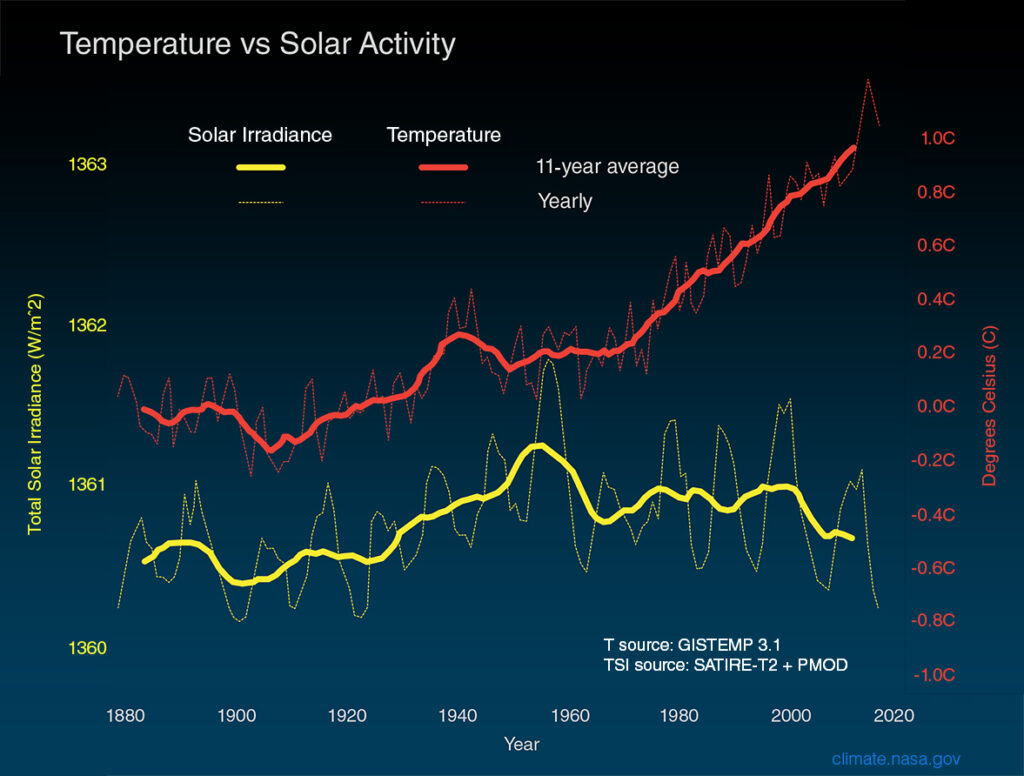
Most contraversial is the suggestion that the sun – not CO2 – has triggered some of the Earth’s warming since 1750. According to AR5, the latest IPCC report, the increase in radiative forcing due to the sun since 1750 is only 0.05 W/m2, compared to a total increase of 2.29 W/m2, mainly caused by CO2. This is corroborated by NASA data (below), albeit note per our comments above that early data are indirectly inferred not measured. Some studies go even further and downplay whether the ‘Little Ice Age’ was even a globally coherent event (Neukom, 2019). But on the other side of the spectrum, other studies based on niche isotope measurements have estimated solar irradiance increased by as much as 4-6 Wm-2 since 1750. Other papers in the last decade claim greater solar activity in the second part of the 20th century than any time in the past 10,000 years. We have not reviewed all of these studies. As a reasonably literate analyst, it is merely noteworthy that there appears to be such a large apparent range of estimates and uncertainty surrounding the sun’s contribution to global temperatures.
What’s Changing: New Data? New Models?
To begin addressing the uncertainties about the sun, two new satellites are going to help. Both have recently launched into space. And their evidence could yield some meaningful new evidence, helping us to model the sun’s future intensity.
The European Space Agency’s Solar Orbiter satellite was launched into space on the 10th February 2020. During its 7-year mission, the satellite will make close approaches to the sun every 6-months, to observe the way magnetic activity builds up. In order to gain a novel perspective, the satellite will use the gravitational pull of Venus to slingshot itself out of the plane where all the planets orbit the sun, in order to observe the solar system from a 25-degree angle. This could help understand the sun’s poles and magnetism much better.
NASA’s Parker Solar Probe was launched in August-2018, billed as the first mission ever to “touch” the sun’s outer corona. It will reach 6M km from the sun’s surface, compared to Earth, which is c150M km away. It will assess the structure and dynamics of the sun’s coronal plasma, magnetic fields and energy flows. A new wave of 47 research papers was released in February-2020, based on the mission’s data and findings so far.
What Implications for Energy Transition?
What is not conceivable to us is that any imminent data source will disconfirm the Earth’s recent warming trend, its links with CO2, or the need to decarbonize global energy. Indeed, the most likely outcome of deeper solar research is to allay the mysteries described above.
But the new data could nevertheless have profound consequences for companies, investors, the global economy and the world, which may be interesting to consider.
What if we are due for a grand solar minimum? A 0.2-0.3C downward influence on temperature from 2020-2070 may ‘buy more time’ for the incubation of new technologies (at least 3-years, according to NASA, possibly more). Some commentators talk about acting urgently to stop climate change, which may entail policies that are economically debilitating. Immediately imposing debilitating policies may not be needed if evidence strengthens for a GSM.
What if we are due for a very large solar minimum? As we have discussed, some climate scientists have postulated a much larger role for the sun, with potentially larger temperature reductions ahead by 2050, on the scale of 1-2C. There is a remote chance that new solar data may stoke these theories. Although remote, it is fascinating to consider how market sentiment might change, if we suddenly found our carbon budgets doubled, or our timeline to achieve an energy transition pushed out by 20-years.
What if we are due for further solar intensification? As we have also discussed, there is a possibility that a further 1.3-2.5C of warming lies ahead, due to solar intensification, linked to a super-grand solar cycle. It is difficult to imagine what would happen if evidence mounted for such a theory. Would it tempt the world to give up on mitigating climate change, or to double down?
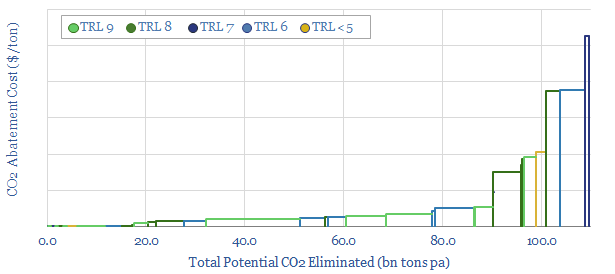
Our research aims to identify economic technologies that can best drive a full decarbonization of the global energy system by 2050 (chart below, data-file here). As a researcher, it is always important to stress-test your firmly-held premises, and to consider what new evidence could unseat them, hence we hope you found this short article useful.
Sources:
Meehl, G., Arblaster, J. M. & Marsh, D. R. (2013). Could a future “Grand Solar Minimum” like the Maunder Minimum stop global warming? Geophysical Research Letters
Usoskin, I. G. (2017). A history of solar activity over millennia. Living Review of Solar Physics.
Barnard, L. Lockwood, M., Hapgood, M. A., Owens, M. J. & Davis, C. J. (2011). Predicting space climate change. Geophysical Research Letters.
Neukom, R., Steiger, N., Gomez-Navarro, J. J., Wang, J. & Werner, J. P. (2019). No evidence for globally coherent warm and cold periods over the pre-industrial common era. Nature, 571
What will happen during a new Maunder Minimum? https://www.mwenb.nl/what-will-happen-during-a-new-maunder-minimum/
Zharkova, V. V., Shepherd, S. J., Zharkov, S. I. & Popova, E. (2019). Oscillations of the baseline of solar magnetic field and solar irradiance on a millennial timescale. Nature Scientific Reports