
California’s power grid ranges from 15-61GW of demand. Utility scale solar has almost quadrupled in the past decade, rising from 5% to almost 24% of the grid. Yet it has not displaced thermal generation, which rose from 28% to 30% of the grid. We even wonder whether wind and solar are entrenching natural gas generators that can backstop their daily, weekly and even seasonal volatility.
This data-file aggregates descriptive statistics into California’s power grid, plotting California power generation over time, looking across 250MB of CAISO data into solar, wind, nuclear, hydro, imports and thermal generation, every five minutes, for almost a decade.
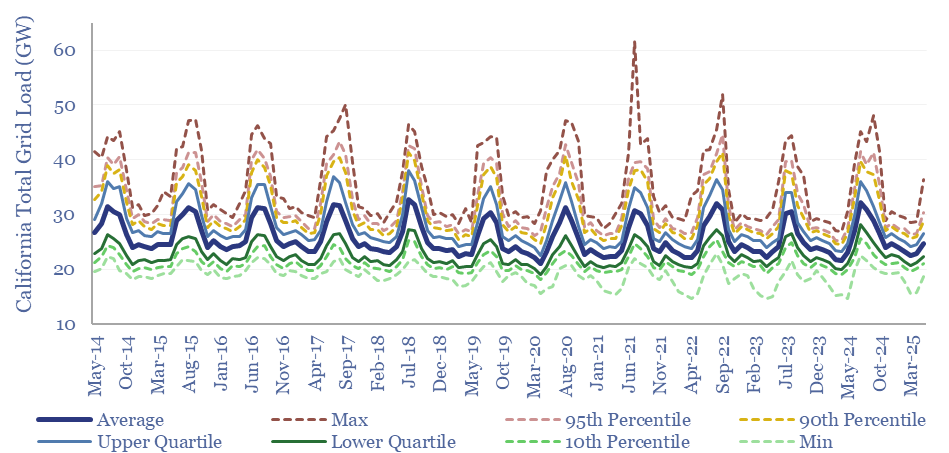
Over the past decade, California’s power grid has averaged 26GW of load, but the demand is highly variable, troughing at 15GW in April-2022 and peaking at over 61GW in July-2021. Summer demand is almost 50% higher than winter demand due to air conditioning.
Utility-scale solar is the biggest change in the generation mix, rising from 5% of the grid to 23% of the grid over the past decade. Solar generation is volatile. The average load from solar was 6GW in the trailing twelve months, but c40% of the time, solar generation is zero, while 25% of the time it is above 16GW.
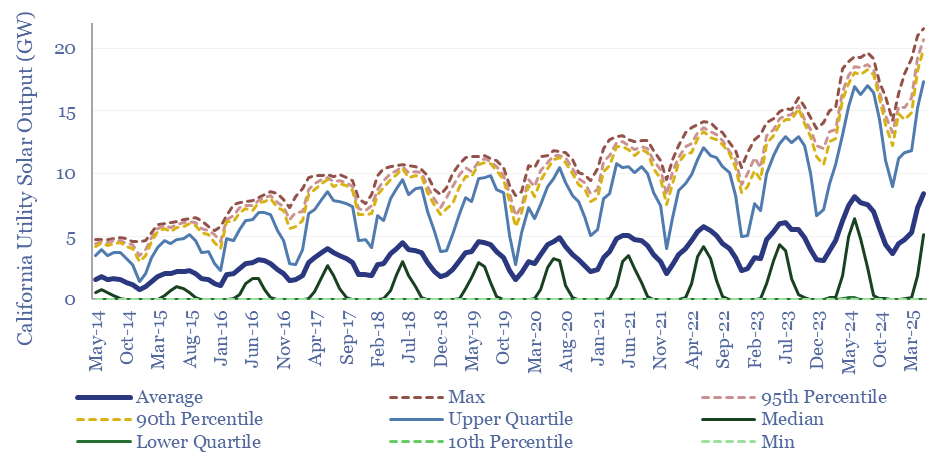
Seasonality also matters for solar. Solar generates around 2x higher output during the summer months than the winter months. Similar charts for wind are in the data-file.
Thermal generation has not necessarily been displaced by the rise of solar and wind in California’s grid, but arguably, entrenched, as gas-fired power plants can rapidly ramp up production, after the sun sets, or in non-sunny months.
The increasing volatility of California’s power prices rewards natural gas generators, but is not high enough to bring longer-duration battery storage into the money.
Total thermal generation has actually risen from 28% of the grid in 2017 to 30% of the grid in 2023, albeit the picture is somewhat distorted by annual fluctuations in hydro output and the change in imports, as tabulated in the data-file.
An all time record for California’s thermal generation is shown in July-2024, reaching 31GW. In other words, despite ramping renewables and batteries, it has not been possible to shutter thermal generation capacity overall, and the grid has leaned on more thermal generation capacity than ever. Maintaining two totally separate generation systems is the key reason we think renewables inflate total system costs.
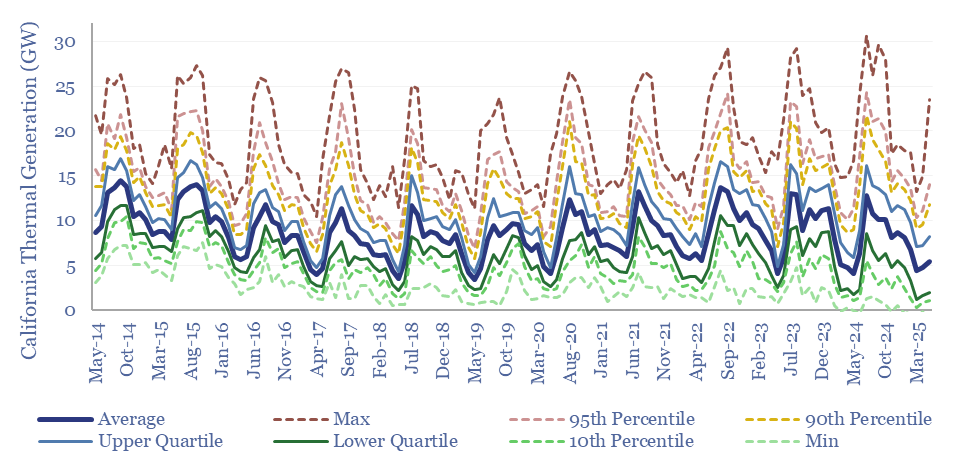
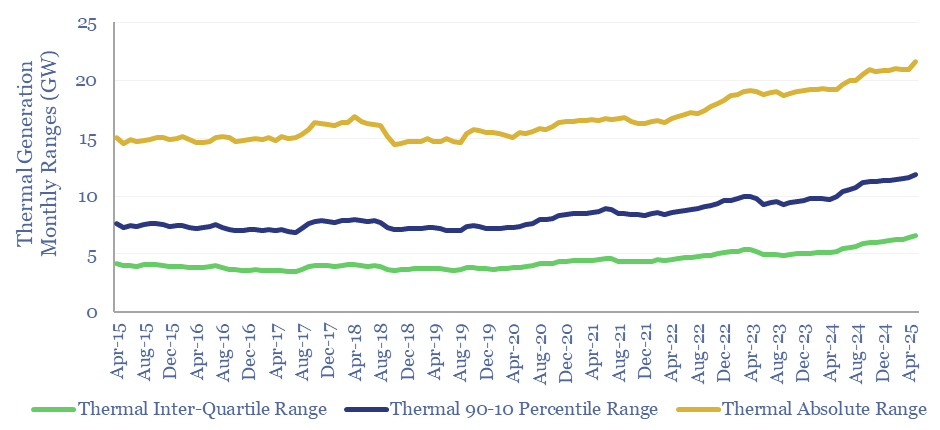
Is California’s thermal generation base backstopping its renewables? There is also evidence of thermal generation plants being run more flexibly, to ‘backstop’ solar and wind in California’s grid, with rising interquartile ranges, absolute ranges and deviations between upper-decile and lower-decile generation.
Full descriptive statistics are in the data-file, covering all of California’s main generation sources — solar, wind, nuclear, hydro, imports and thermal — and the proportionate share of each one. For each month, we plot each generation source’s minimum output, 10th percentile, lower quartile, median, mean, upper quartile, 90th percentile and maximum output.
The second data-file is an attempt to disaggregate California’s power price volatility in 2024, by source. I.e., how much is explained by time of day, day of the week, temperatures, wind volatility, solar volatility, gas prices, and other random outages and fluctuations? Based on this data-file, we have written up some conclusions on how renewables are changing power price volatility.