Does real-world power price volatility follow a regular daily pattern (suited to batteries), incur periodic and protracted price spikes (suited to gas back-ups), or fluctuate somewhat randomly in real time (suited to DSR, batteries and gas generation?). To answer this question, we have attributed 2024 power price volatility, in the wind-heavy UK grid (9-pages) and the solar-heavy California grid (8-pages).
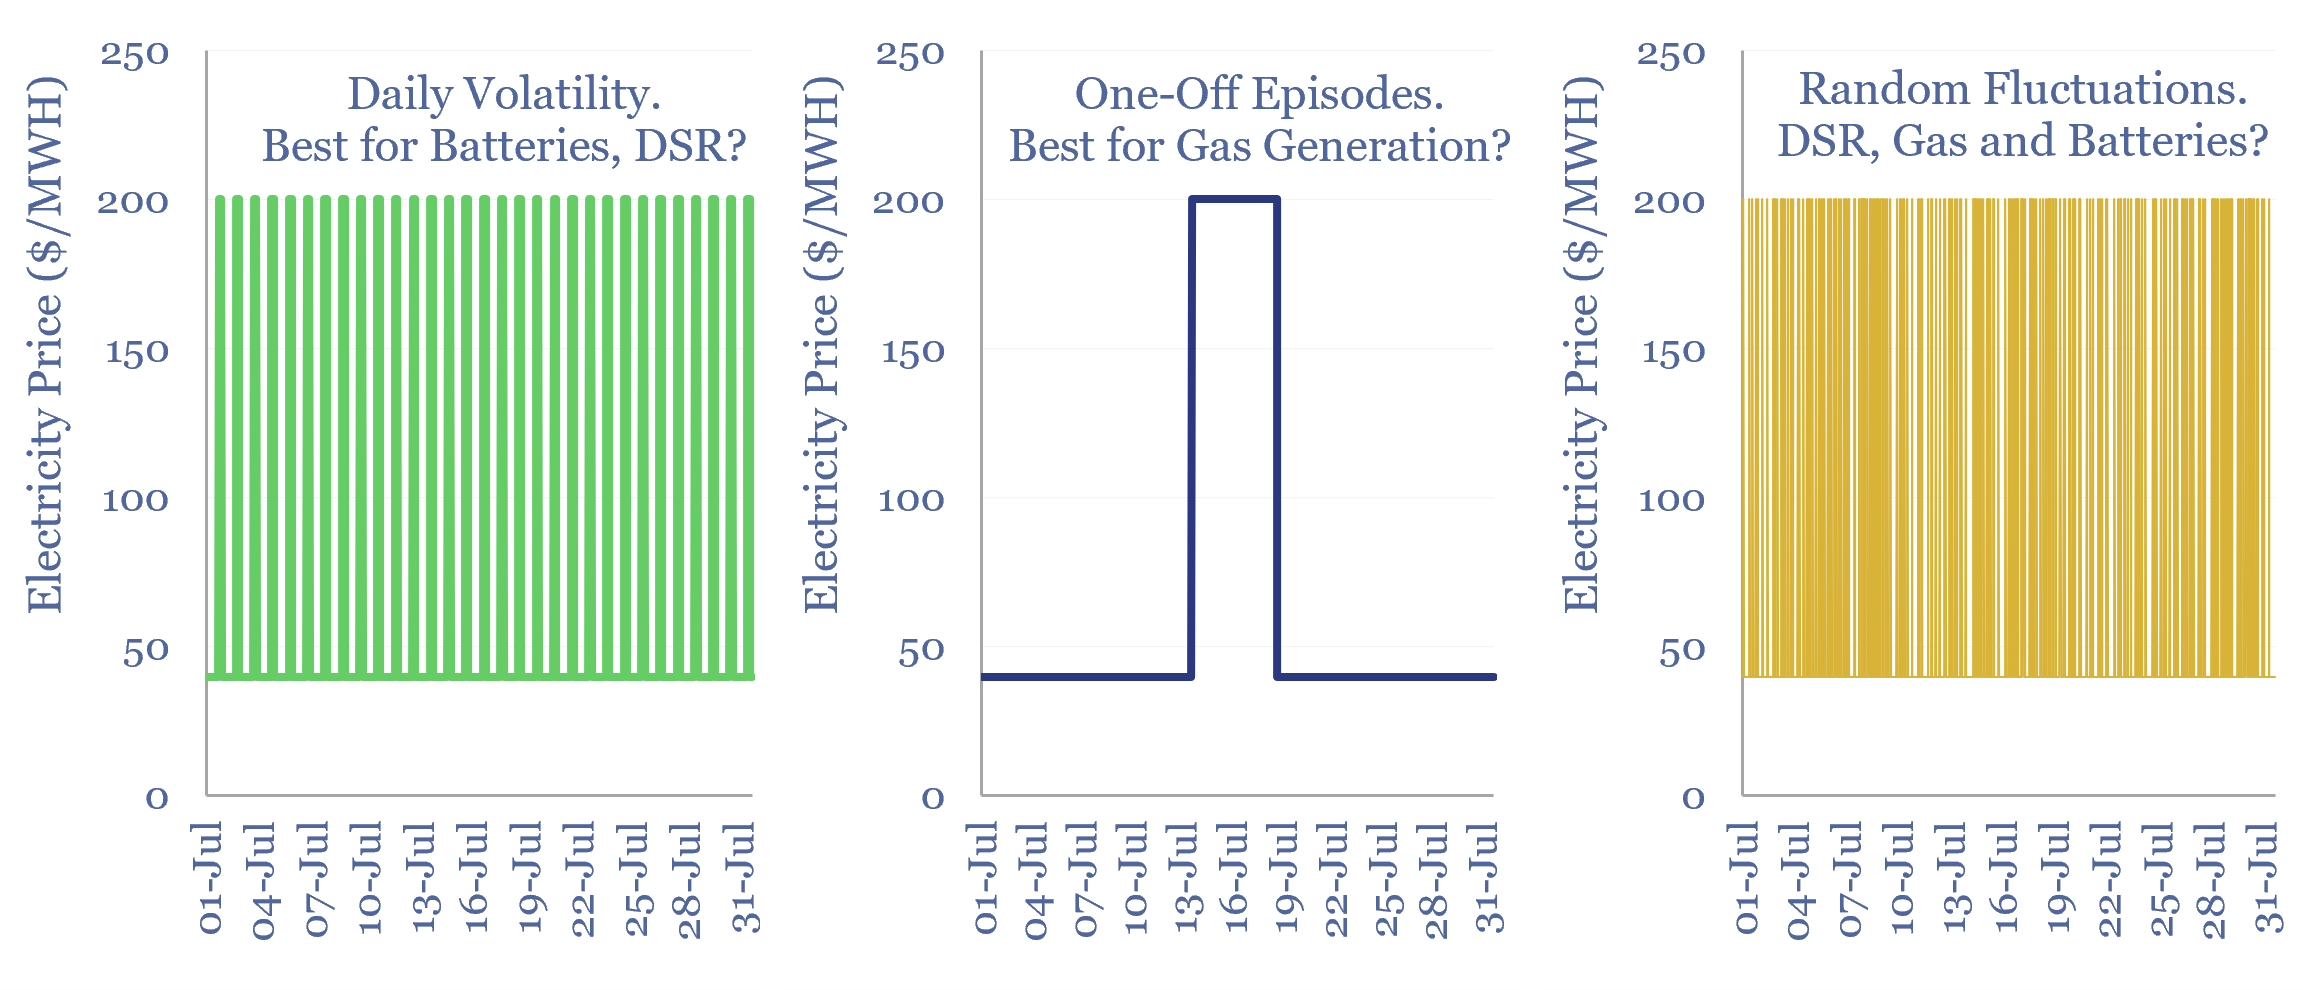
The three charts above represent highly simplified power pricing regimes, with the exact same mean averages of $67/MWH, and the exact same standard deviations of $60/MWH. In all three charts, power prices run at $40/MWH for 83% of the time, then spike to $200/MWH for the other 17% of the time. What differs is timing.
The importance of these three different types of volatility is explained on page 2 of the UK case study. But in short, the left-hand chart with a daily volatility pattern would be particularly well-suited to grid-scale batteries.
The middle chart with periodic yet protracted price spikes would be suited to gas peaker plants, and other forms of flexible gas generation.
And the right-hand chart, with somewhat random but very frequent fluctuations, could be particularly well-suited to demand-side response measures (aka load-shifting), as covered in our outlook for smart energy.
The rise of renewables is also increasing the volatility of power grids. And so, it is interesting to understand what types of volatility are prevalent, in both a wind-heavy grid like the UK and a solar-heavy grid like California.
Time of day explains a much lower share of the variance in 2024 power prices in either grid than we had expected, although time of day does have 3x more predictive power in a solar-heavy grid such as California, compared to a wind-heavy grid like the UK, as discussed on pages 4-5.
Renewables volatility explains a larger share of the variance in both UK and California power pricing in 2024. For the UK, the largest contributor is wind dunkelflautes, one of which occurred in December-2024, explaining a surprisingly high share of the variance. For California, it is price spikes, after sunset, on hot summer/autumn days, with high AC demand.
Somewhat random, short-term volatility explains the highest share of variance in UK power pricing in 2024, and is also a major contributor in California. Although California does see more power price volatility inherited from gas price volatility.
Our interpretation of the data from both grids is likely most supportive for smart energy deployments that can shift loads, ideally even trim loads, during times of grid strain. We also think the volatility patterns entrench gas back-ups and support flexible gas generation.