Grid-scale batteries are not simply operated to store up excess renewables and move them to non-windy and non-sunny moments, in order to increase renewables penetration rates. Their key practical rationale is providing short-term grid stability to increasingly volatile grids that need ‘synthetic inertia’. Their key economic rationale is arbitrage. Numbers are borne out by our case study into battery operations.
Victorian Big Battery was the largest grid-scale battery in the world, when it was installed in Victoria, Australia in 2021. It was installed by Neoen and consists of 212 x 3MWH Tesla Megapacks. Total capacity is 300MW on a power basis and 450MWH on a storage basis (as can be contrasted in our MW/MWH battery comparison).
How does a grid-scale battery operate in practice? To answer this question, we collated an entire year of load and generation data for Victorian Big Battery, using data from Aemo.
Across the entirety of 2023, Victorian Big Battery absorbed 122GWH of power and discharged 102GWH of power, for a total net efficiency of 84%. This is in line with our typical estimate for a grid-scale lithium ion battery to have c85% efficiency.
The utilization of the battery equates to 0.7 charge-discharge cycles per day, as shown in the chart below, in MWH of charge-discharge per day per MWH of storage capacity. However, the utilization rates varied throughout the year.
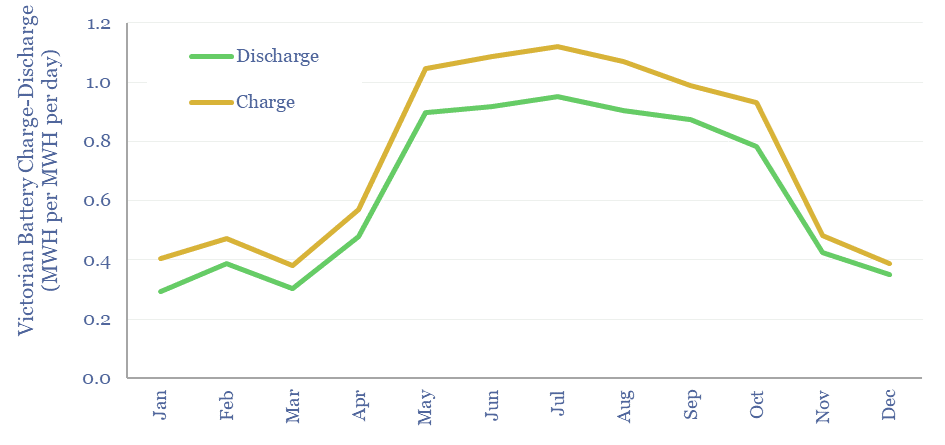
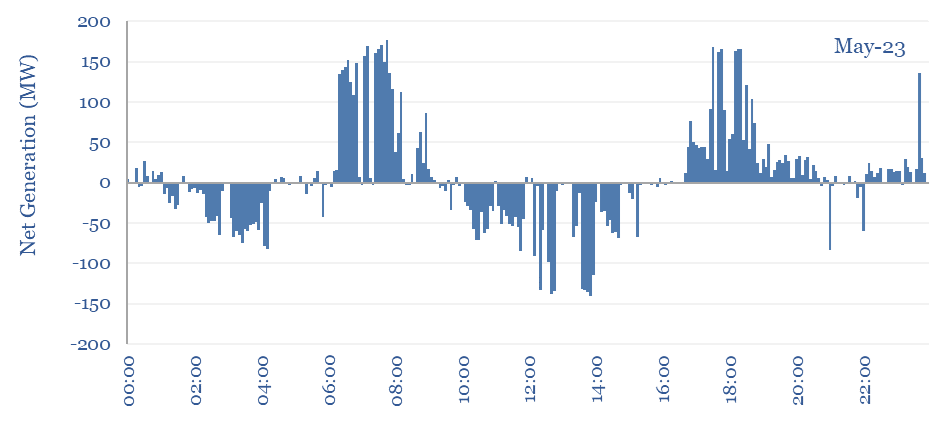
Outside of summer months, utilization of Victorian Big Battery averaged 1MWH of charge-discharge per day per MWH of storage capacity. The profile for the median day is shown in the chart below.
Some commentators argue that the main role of grid-scale batteries will be to enable higher solar penetration in power grids, by ‘storing up excess sunlight in the middle of the day, and then re-releasing that energy at night’. This is not entirely borne out by Victorian Big Battery.
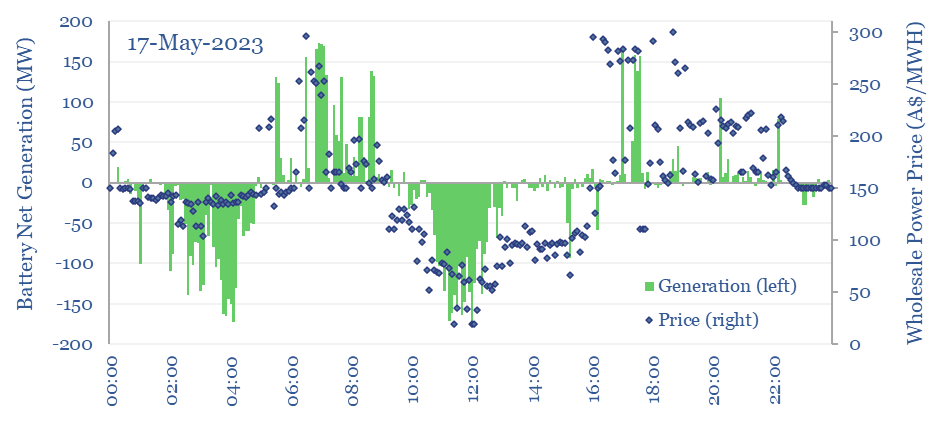
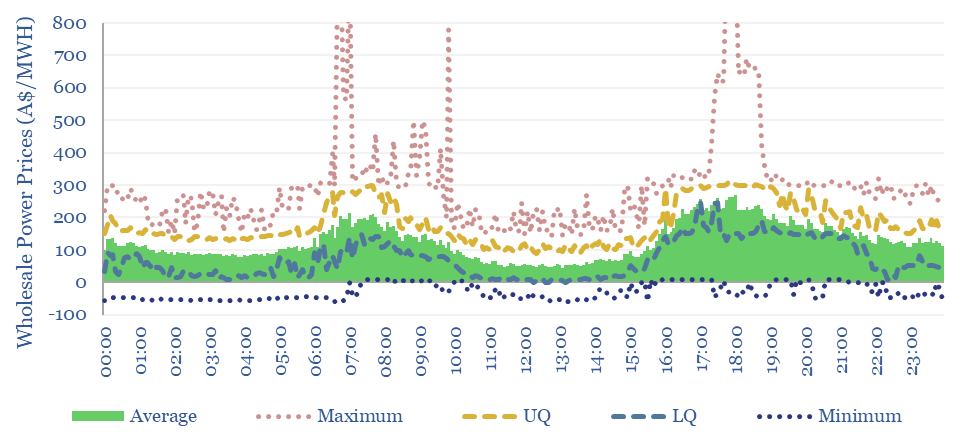
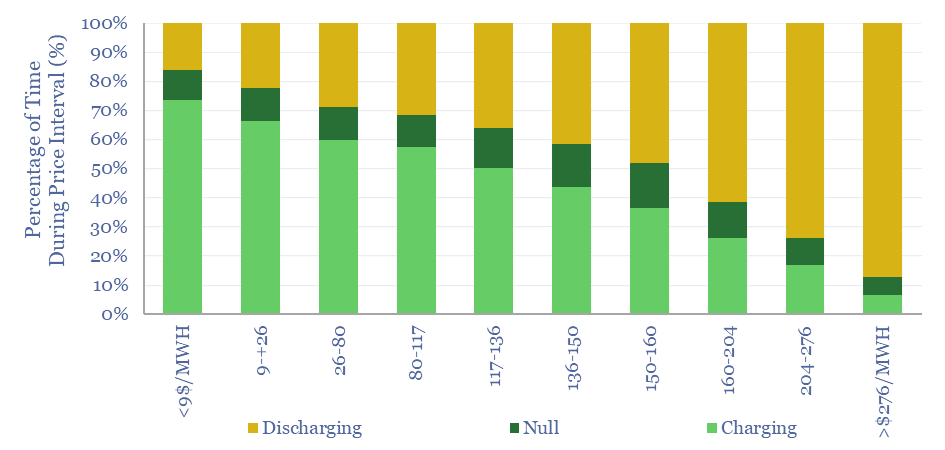
The primary economic rationale for Victorian Big Battery has been economic arbitrage. The battery consistently buys power during times of low prices (1am-5am, 10am-3pm, chart below) and sells power at times of high prices (6am-8am, 4pm-8pm).
The battery is reasonably good at economic arbitrage, but not perfect. When prices were negative in May-2023, Victorian Big Battery was able to charge about 80% of the time. When prices surpassed A$200/MWH, it was able to discharge about 80% of the time. The average storage spread is calculated in the data-file, but was lower than the level we think is necessary for economic returns in our grid-scale battery models.
What is helping economics is that the battery is also providing crucial smoothing services in the grid. Inertia and frequency control come for free with rotating generators. But in renewable heavy grids, these are provided as an ancillary service by grid-scale batteries. This is visible in the volatility of charts in the data-file. 5-minute by 5-minute volatilty is +/- 40MW.
Moreover in summer months, Victorian Big Battery is operated almost entirely as a contingency reserve. Specifically, this means that it is not charged and discharged to its maximum extent each day, but sits with a high state of charge, and provides 250MW of system integrity protection (SIPS), including synthetic inertia for solar-heavy grids, and the capacity to kick in should some large new load start up, or some large generation source suddenly disconnect. This is part of capacity markets.
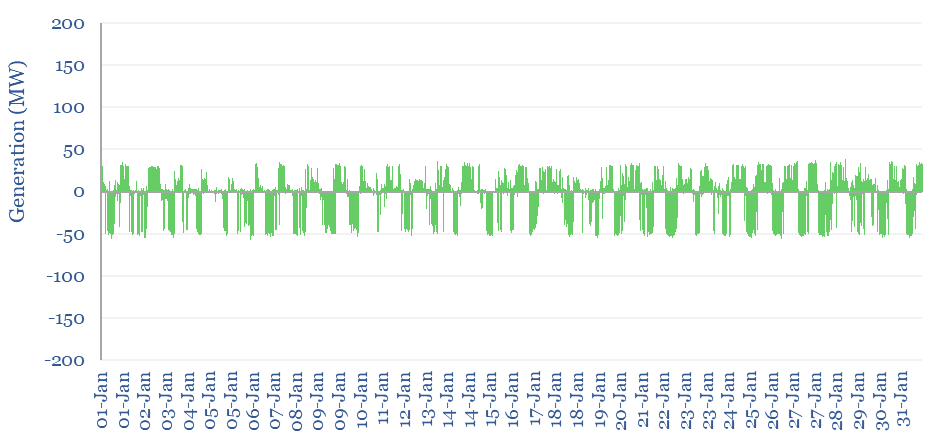
Underlying data into real-time battery charging and discharging, at 5-minute intervals, are available in the data-file, for a selection of months (Apr-23, May-23, Jan-23) and compared with wholesale grid prices. It is interesting to pour over the charts, and see how batteries behave minute-by-minute, day-by-day and in response to pricing signals.