Pumped hydro facilities can provide long-duration storage, but the utilization rate is low, and thus the costs are high, according to today’s case study into the pumped hydro generation profile within the Snowy Hydro complex in Australia. Tumut-3 can store energy for weeks-months, then generate 1.8 GW for 40+ hours, but it is only charging/dischaging at 12% of its nameplate capacity.
Tumut-3 is the largest single generating facility in the Snowy hydro and pumped hydro project, in New South Wales of Australia, whose history goes back to 1949.
1,800MW of power can be generated when up to 4,300 m3/s of water descends 150m under gravity through 6 x 300MW Toshiba turbines, from the 2,000 hectare Talbingo Reservoir into the 400 hectare Jounama Pondage, then onwards into the Blowering hydro plant.
Equally, 600MW of power can be ‘stored’, when 300 m3/s of water is pumped back up from Jounama to Talbingo, by each of 3 large pumps.
Real-world data into Tumut-3 matters generally for the costs of using pumped hydro to backstop renewables, and specifically for the A$12bn and 2.2GW Snowy 2.0 project, under construction, and featuring 27km of tunnels, the longest of any pumped hydro station ever built. Snowy 2.0 is directly adjacent to Tumut-3, using Talbingo as its lower reservoir, and cycling water by 700m into the Tantangara Reservoir.
Hence we have compiled the charging and discharging data, at 5-minute intervals for Tumut-3, across all of 2021-23 (over 50MB of data), using data from AEMO.
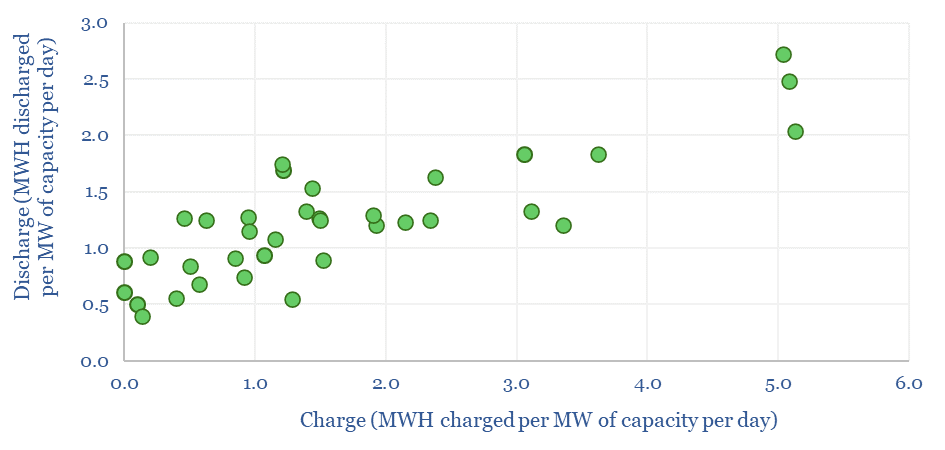
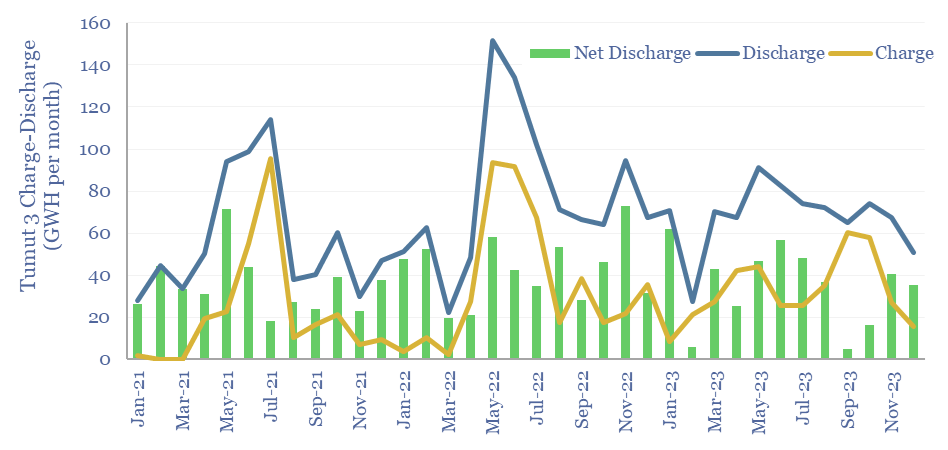
Long duration storage is clearly provided by the facility, as shown in the scatter plot below. Monthly charge and discharge are 82% correlated, but not identical. Statistically, 70% of the energy stored by Tumut-3 is re-released in the same month, and the other 30% is longer-duration.
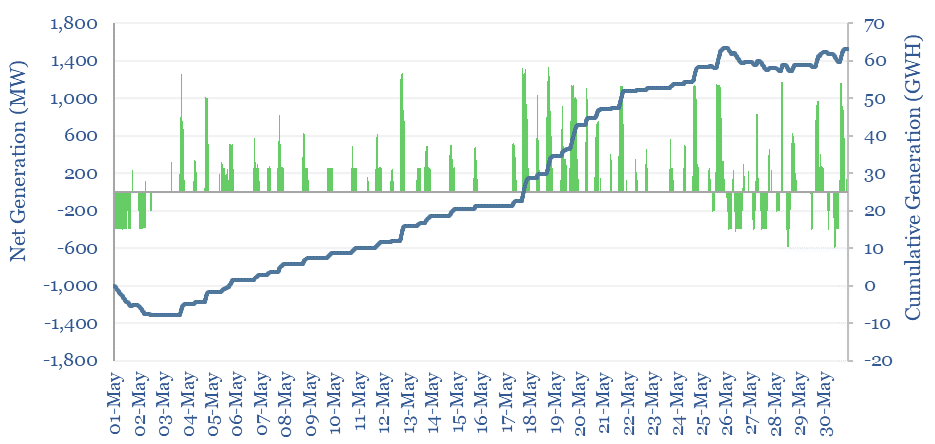
If we zoom in on months with very large quantities of discharging, but small quantities of charging, such as May-2021 or November-2022, then we can see up to 40-hours of cumulative discharging. This is about 10x longer than a lithium ion battery.
Even longer storage durations could be achieved by constructing larger pumped hydro facilities, with larger reservoirs, both upstream or downstream. This is really the only viable long-duration battery, available at large scale today, while development progress continues with redox flow batteries, compressed air or novel chemistries.
However, the key challenge is low utilization. On average from 2021-23, charging occurred at a rate of 1.6 MWH of charging per day per MW of capacity, resulting in 1.2 MWH of discharging per day per MW of capacity.
One reason for the low charging-discharing activity at Tumut-3 in 2021-23 is that heavy rainfall occured in 2022, and thus there were risks of the Blowering Reservoir and the Tumut River flooding. Some may argue that this is simply the nature of the beast of managing hydro assets. Others may wish to adjust future utilization factors upwards.
Either way, and for comparison, a lithium ion battery with daily charging and discharging achieves 4 MWH per day per MW of capacity. And the base case in our pumped hydro cost model is for 5 MWH per day per MW of capacity, which in turn requires a storage spread of 25 c/kWh. At 2 MWH per day of charging per MW of capacity, then the same model requires a storage spread of 60c/kWh.
The key challenge, borne out in this case study, is that long-duration batteries tend to achieve low utilization, which hurts their economics. Hence we think the rise of renewables will entrench natural gas.
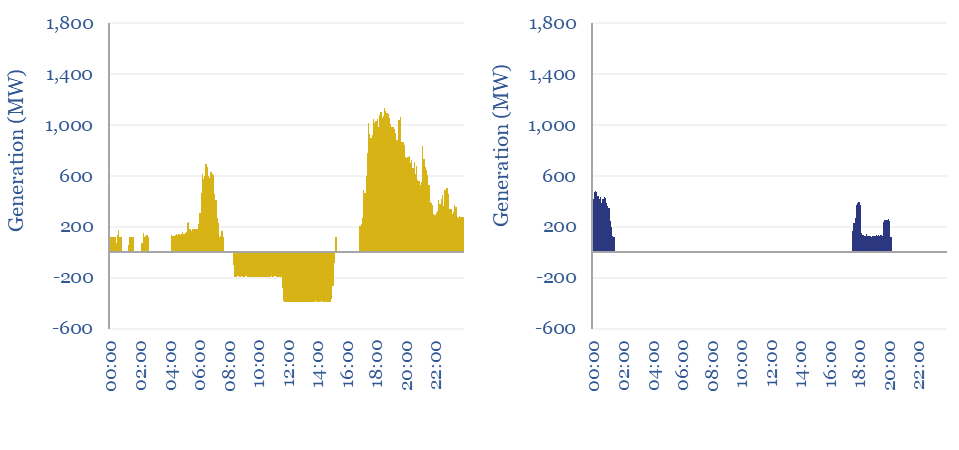
Finally, the evidence suggests that a typical pumped hydro generation profile is less actively used for short-term grid smoothing than lithium-ion batteries. This is borne out by charts in the data-file versus charts in our grid-scale lithium ion battery case study. Data into the charging-discharging by time of day, are shown in the data-file. Underlying data behind all of our charts are also contained in the data-file.