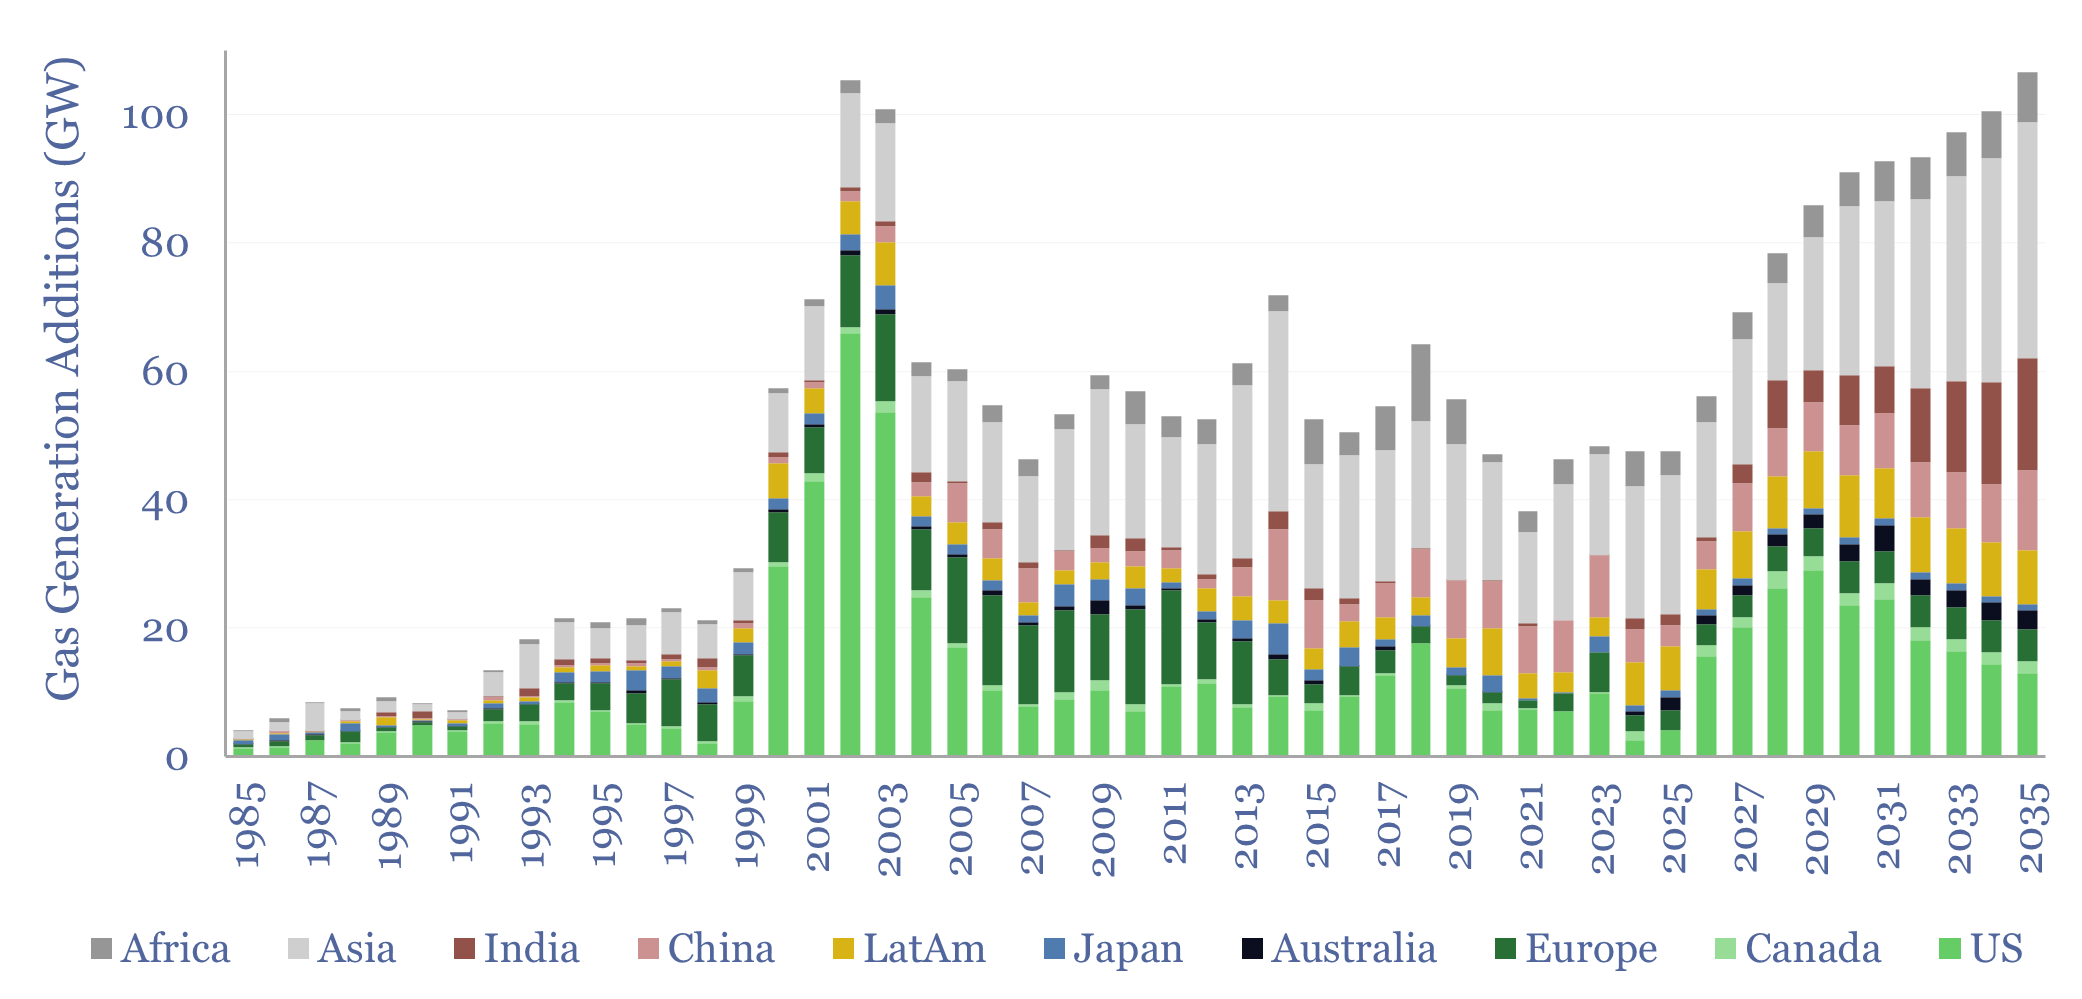
Global gas generation capacity additions averaged 50 GW pa over the decade from 2015-2024, of which the US was 20%, Europe was 10%, Asia was 50%, LatAm was 10% and Africa was 10%. Yet global gas turbine additions could double to 90 GW pa in 2025-35. This data-file estimates global gas turbine capacity by region and over time.
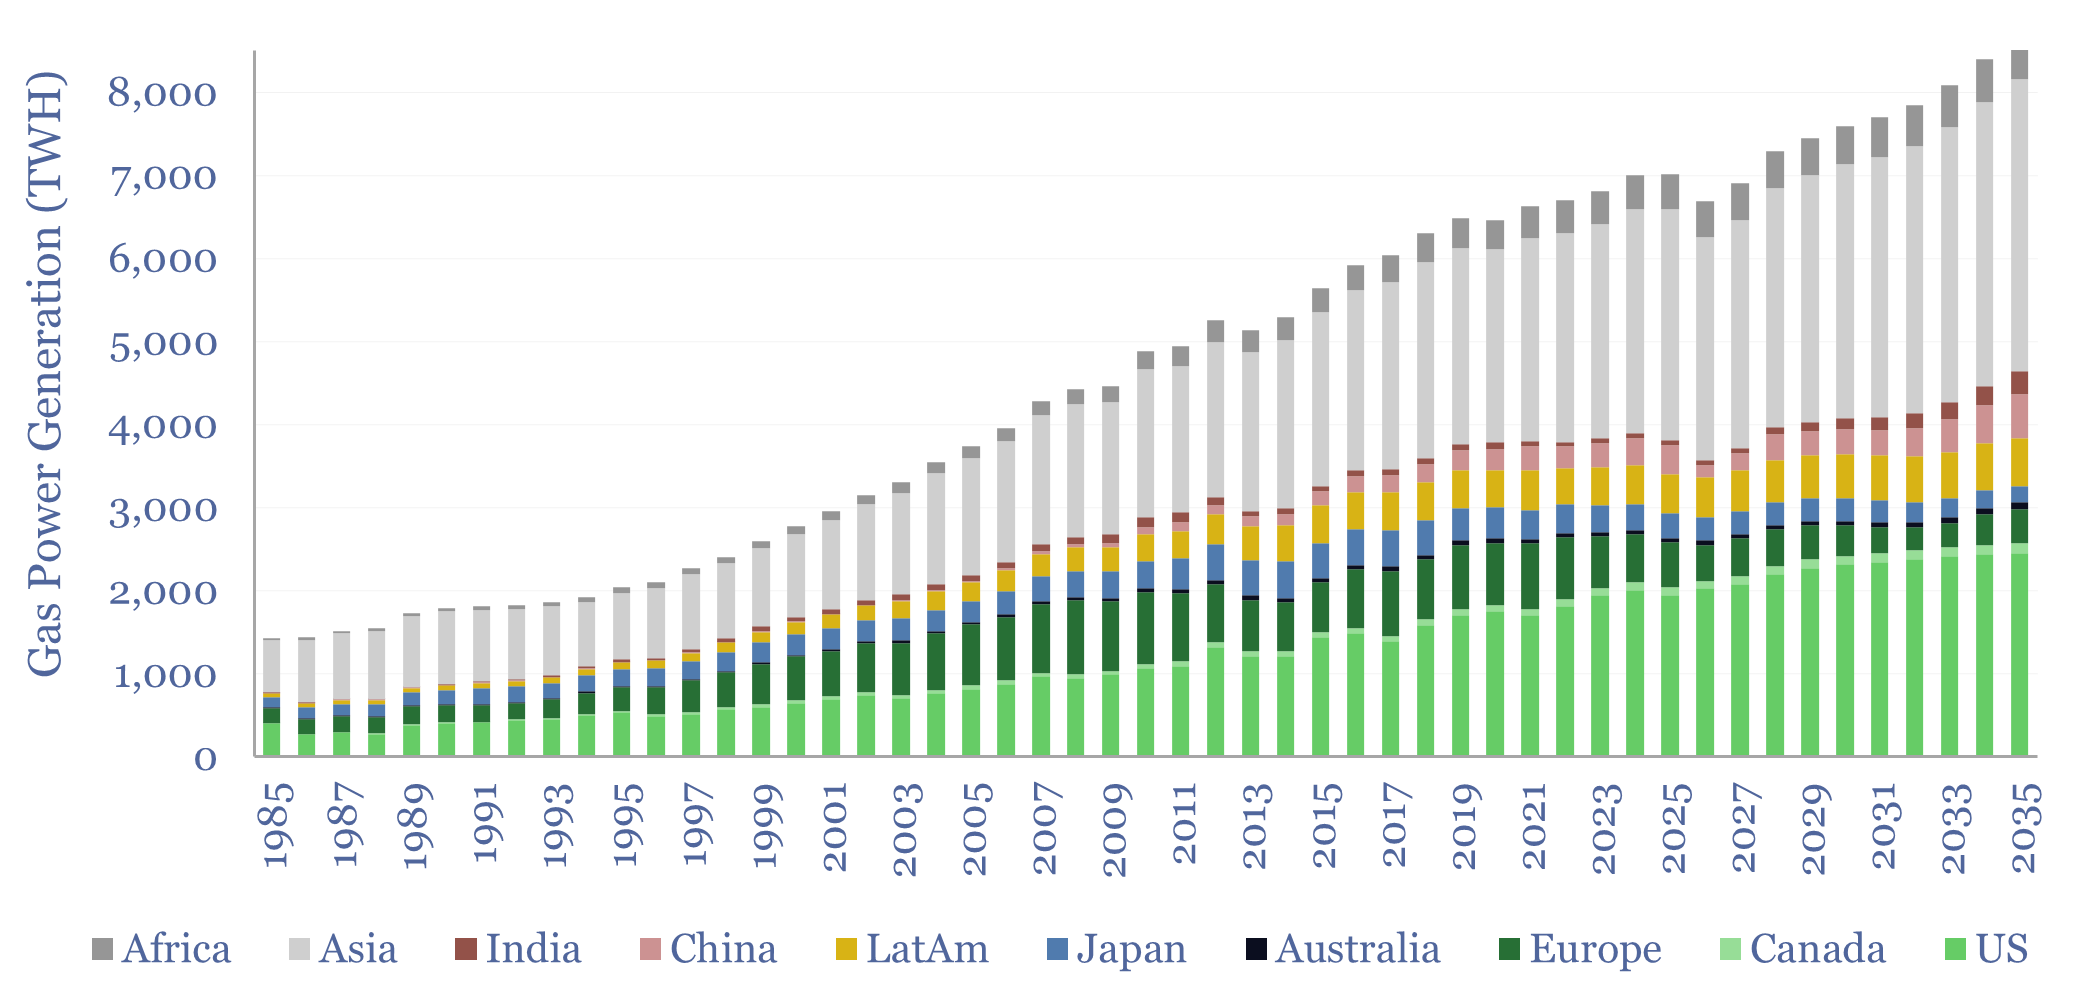
22% of global electricity came from burning 150bcfd of natural gas in 2025. A typical simple-cycle gas turbine is sized at 200MW, and achieves 35-45% efficiency, as incoming air is compressed over 20 stages to 20 bar of pressure, super-heated to 1,250ºC and 100 bar of pressure, then these super-hot, super-pressurized gases expand across 4-5 stages of turbine blades, turning at 3,000 – 6,000 revolutions per minute.
This data-file estimates global gas generation capacity by region and over time, especially global gas turbine capacity by region over time. Specifically, we have started with open source databases of all of the world’s power plants, as published by WRI and GEM. But unfortunately these databases are incomplete.
Hence, we have adjusted some of the historical data using mathematical methods, so that the bridge of capacity additions and retirements matches up with the current fleet of operating gas turbines in each region. The adjustments and workings are shown in the data-file.
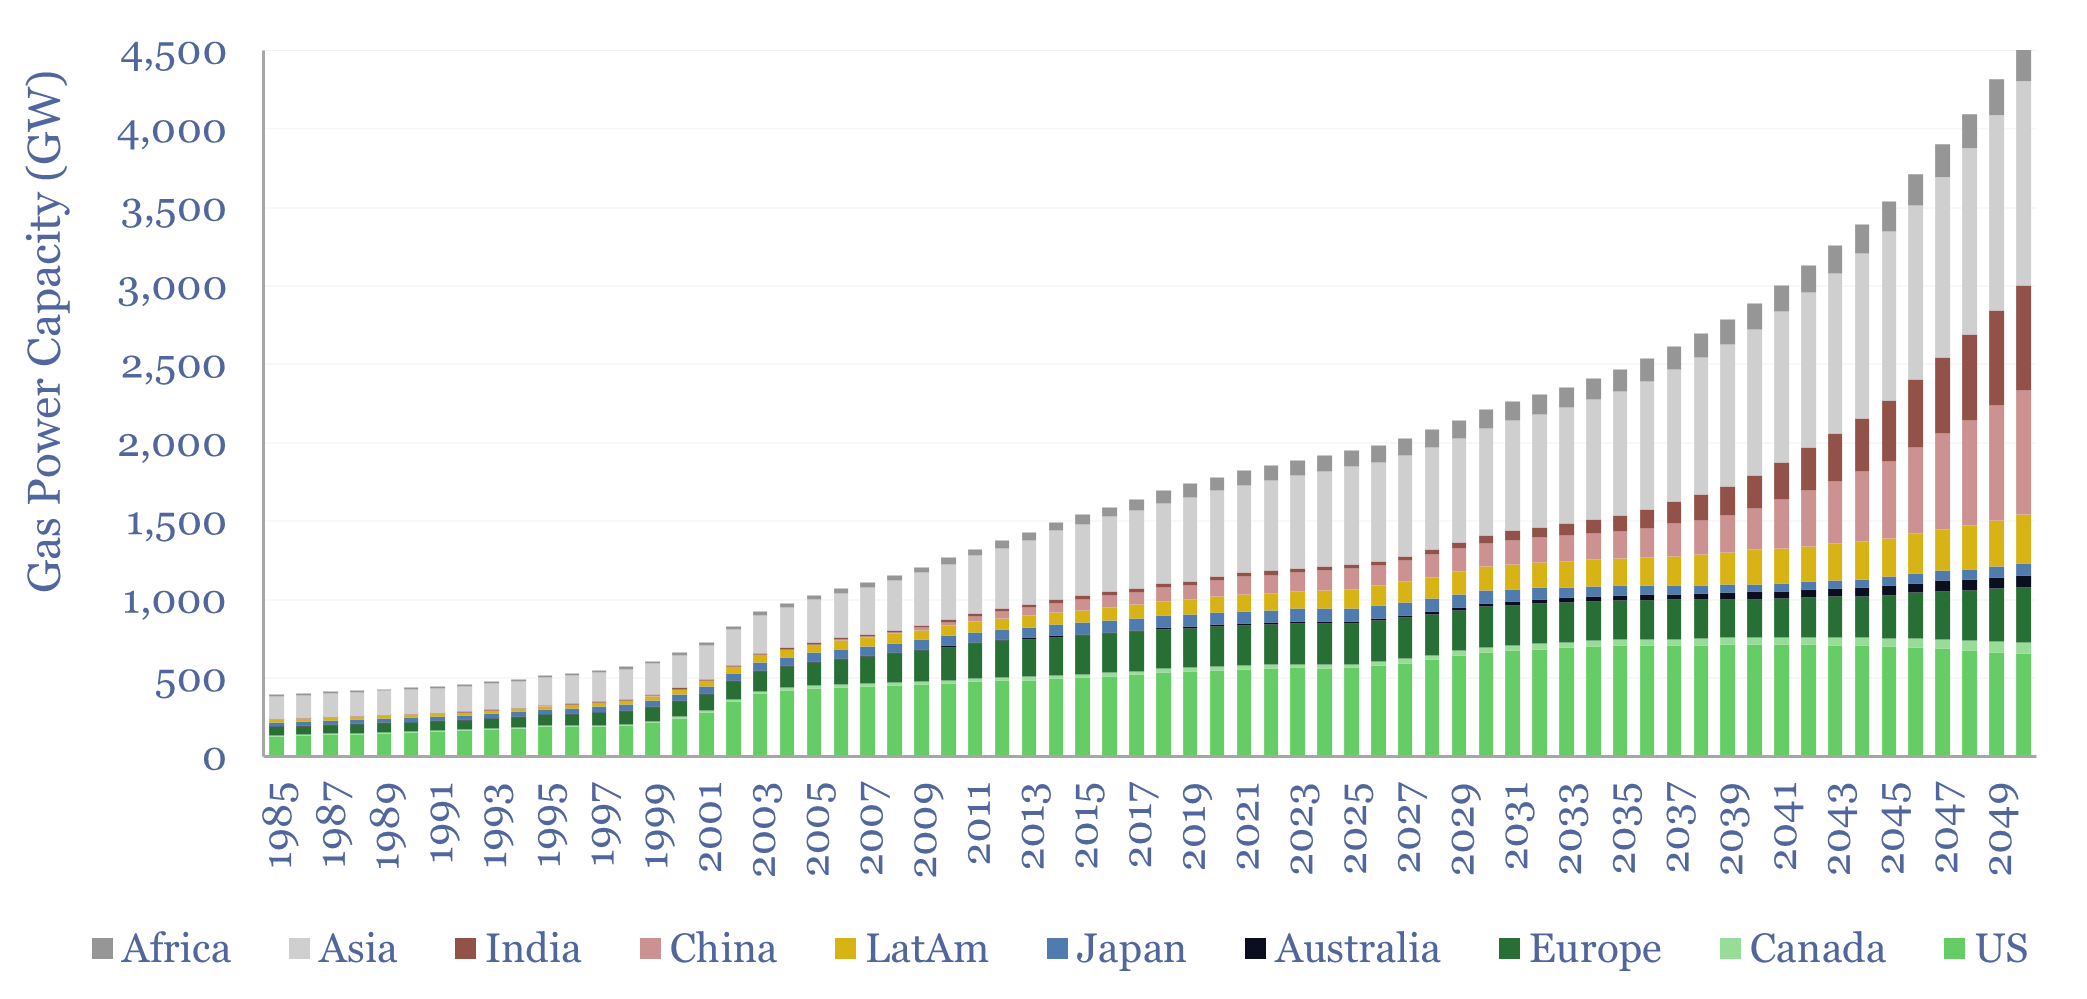
Hence as of 2025, the world has 2 TW of operating gas turbines, of which 30% is in the US, 15% is in Europe, 40% is in other Asia, and around 5% is in both Africa and LatAm. Numbers are available in the data-file.
Utilization rates of the world’s gas turbines provide another way to sense-check the historical data, peaking at 50% in 1999 on a global basis, then declining to 40% in 2025, due to the ramp-up of intermittent renewables, which lowers utilization rates of other power infrastructure, and causes baseload gas to run more like peakers.
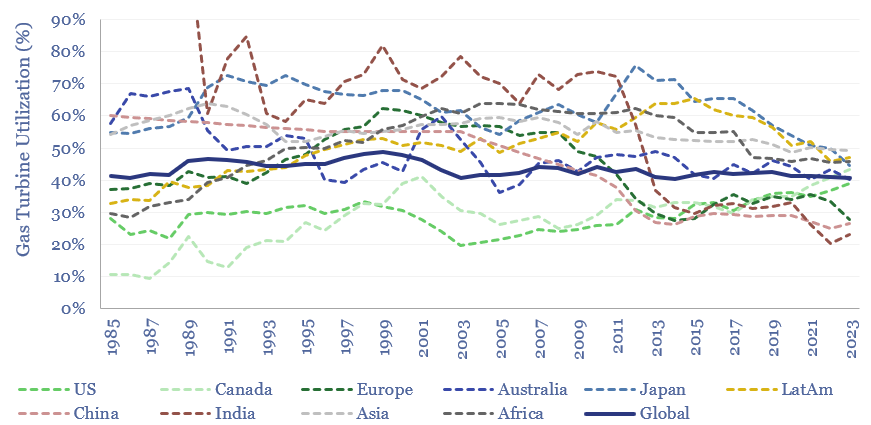
Some of the most price-sensitive regions such as India and China also sharply curtailed gas plant utilization, after LNG prices spiked in the aftermath of the Fukushima nuclear disaster. Though both regions are seen re-accelerating gas utilization by 2030, to meet air quality targets, and as Qatar adds 8 x 8MTpa mega-trains to the global LNG market.
Other regions such as the US have seen utilization rates of gas turbines rise, due to improving economics of gas, linked to the rise of US shale gas, as a low cost source of baseload power, thus displacing coal, which continues in our US natural gas outlook.
Forecasts through 2035-50 are also given in the data-file, both for gas generation capacity demand, and gas generation capacity supply, estimating how global gas turbines by region will evolve as part of the energy transition.