Search results for: “Brazil”
-
Pre-Salt Brazil: FPSO Tracker
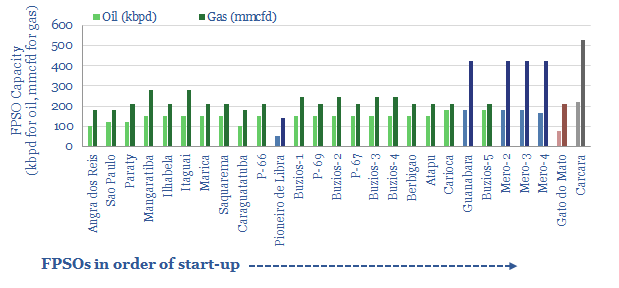
This data-file tracks construction progress of 30 FPSOs being deployed in the Brazilian pre-salt. In each case, we quantify the vessel’s oil and gas handling capacity, development timing and news flow. Pipeline bottlenecks are emerging, and will only be able to export one-third of the pre-salt gas volumes by 2025. The rest must be re-injected.
-
Mero Revolutions: countering CO2 in pre-salt Brazil?
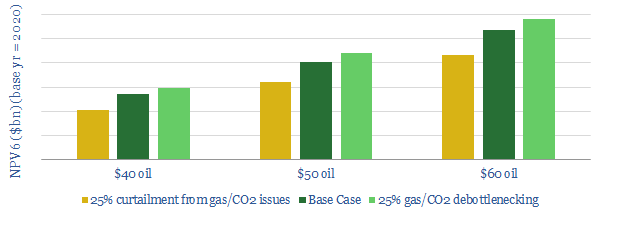
Petrobras, Shell, TOTAL and two Chinese Majors are pushing the boundaries of deep-water technology to develop the Mero oilfield. But the distribution of possible NPV outcomes is very broad, at c$6bn. Challenges remain. The ingenuity required to overcome them should not be under-estimated. Further prizes may be unlocked in the process.
-
Radioactivity of materials: energy, Rare Earths and nuclear?
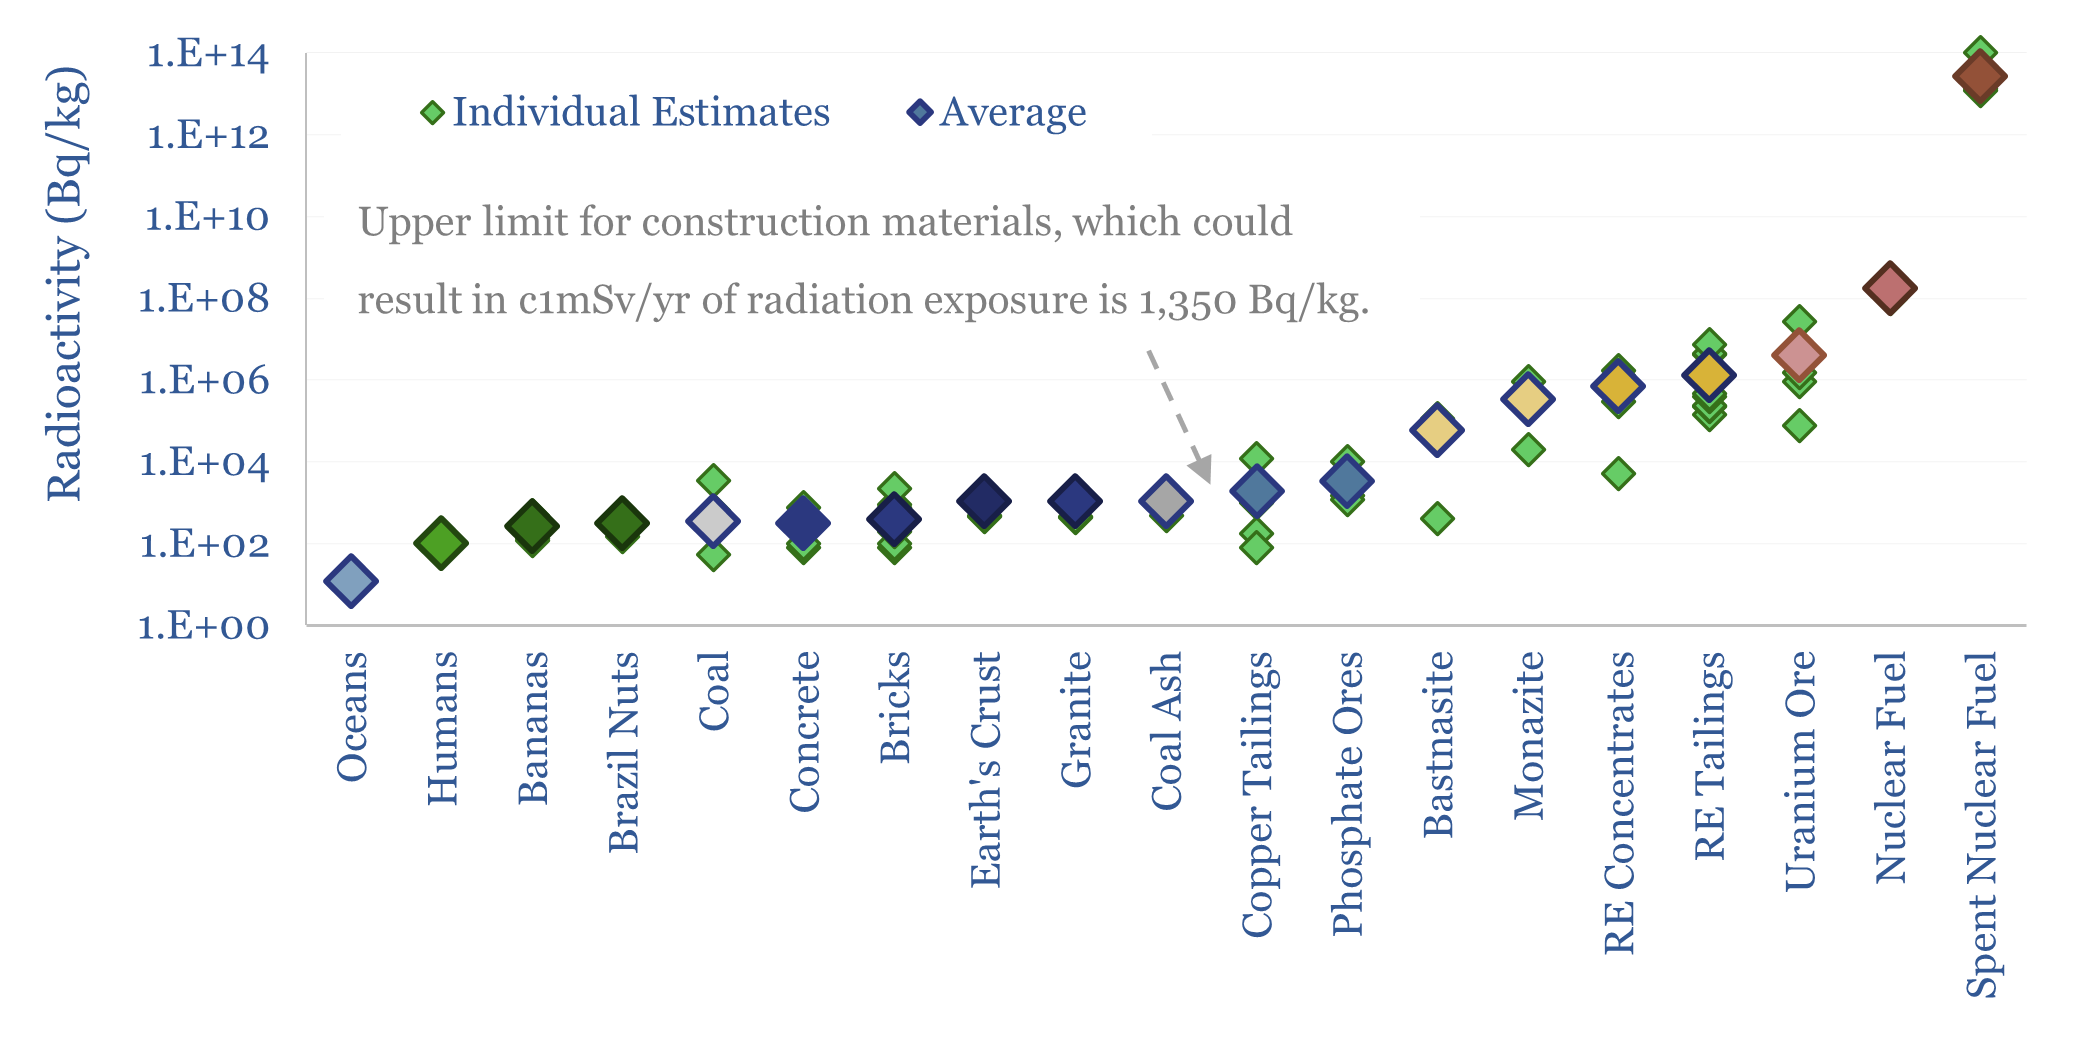
This data-file captures the radioactivity of materials: ranging from 10Bq/kg in sea-water, to 100Bq/kg in humans, to 300Bq/kg in Brazil nuts (the most radioactivity food), to 1,000Bq/kg in coal ash, 2,000Bq/kg in copper tailings, 0.5-1MBq/kg in Rare Earth concentrates and tailings, to 4M Bq/kg in uranium ore, 0.2 bn Bq/kg in nuclear fuel and 10-100…
-
Development Concepts: how much CO2?
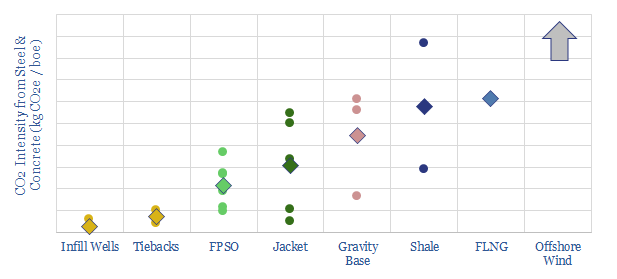
We tabulate c25 oil projects, breaking down the total tons of steel and concrete used in their topsides, jackets, hulls, wells, SURF and pipelines. Infill wells, tiebacks and FPSOs make the most CO2-efficient use of construction materials per barrel of production, helping to minimise emissions. Fixed leg platforms are higher CO2, then gravity based structures, then…
-
Vehicle fleets: service life and retirement age by vehicle type?
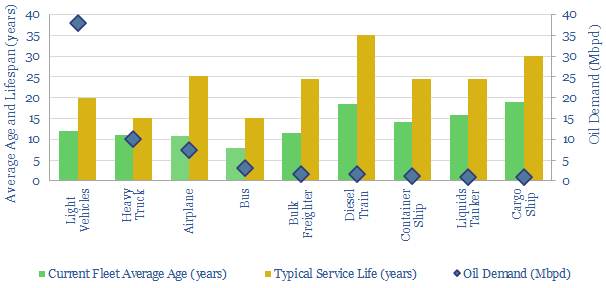
The weighted-average combustion vehicle in the world has a current age of 12-years and an expected service life of 20-years. In other words, a new combustion vehicle entering the global fleet in 2023 will most likely be running through 2043. Useful data and notes are compiled overleaf.
-
Wind turbine capacity factors: by country, by facility?
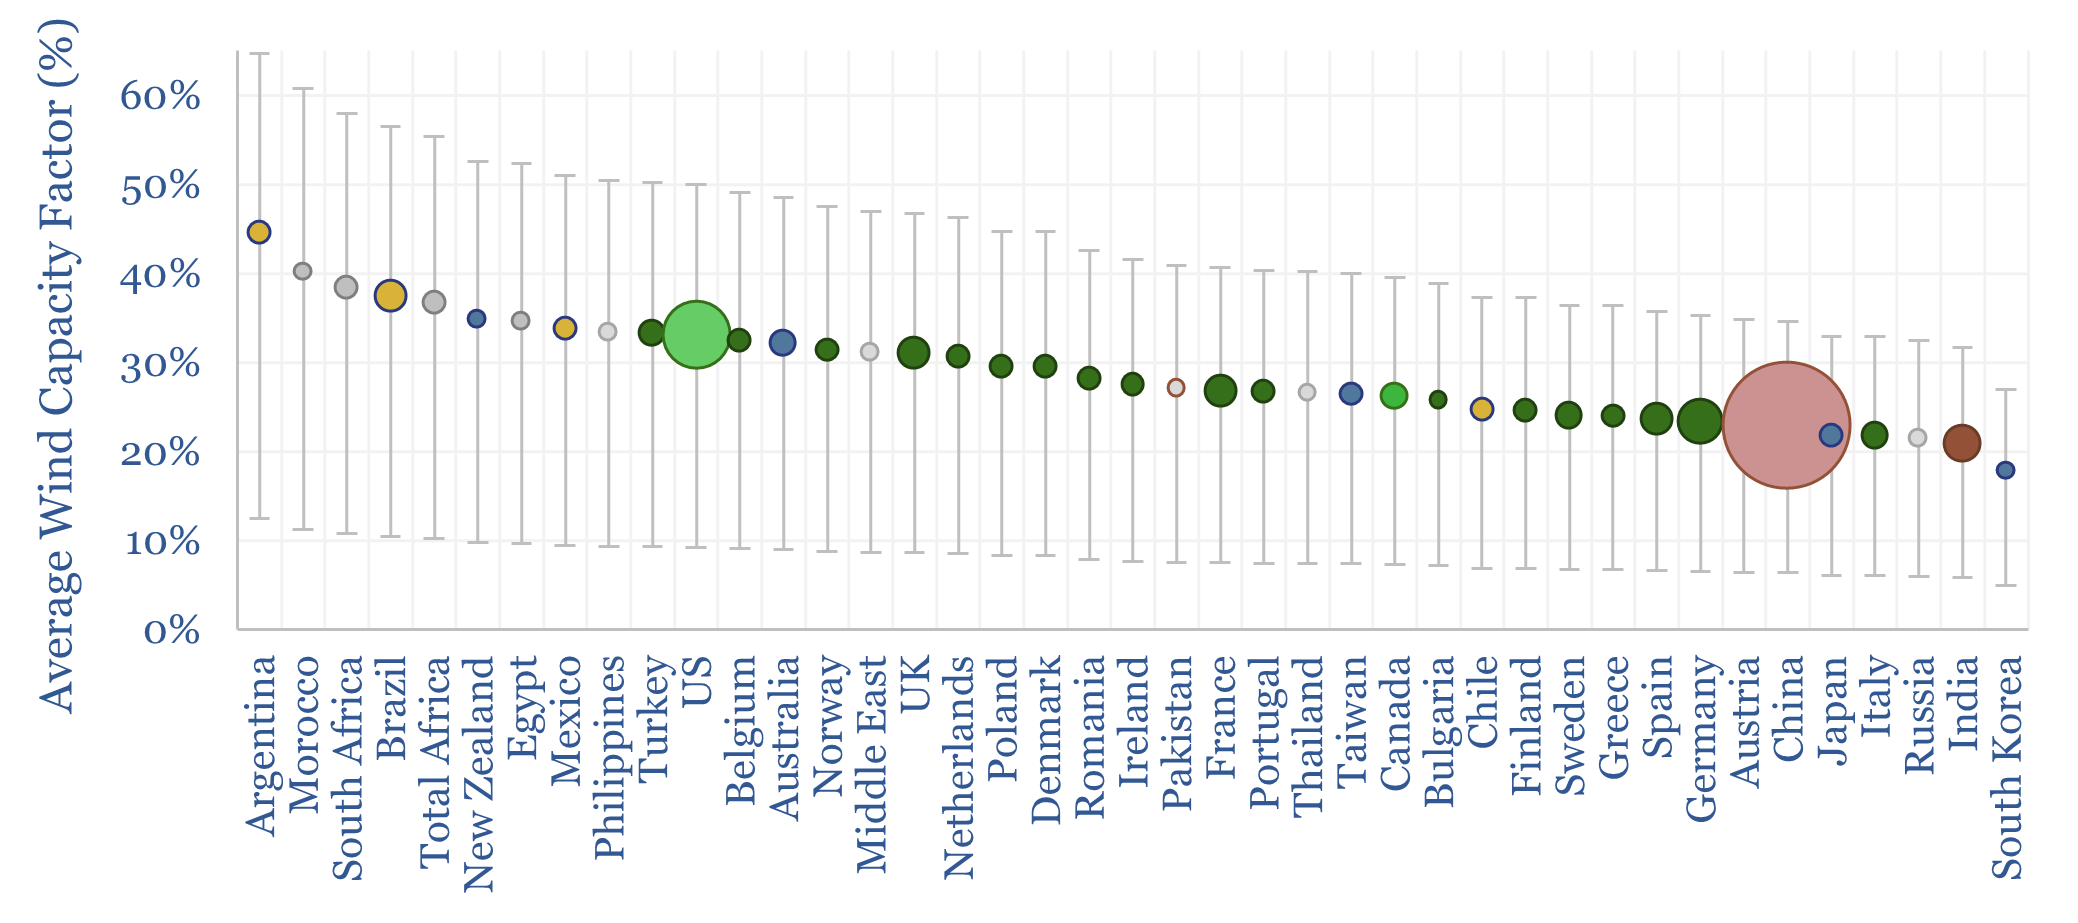
Wind turbine capacity factors average 26% globally. But they vary from c20% in non-windy countries to 45% in the windiest countries. And they also vary within countries, with a normal distribution and a standard deviation of 7-12%. This data-file maps capacity factors of wind power generation.
-
Global commodity trade: by product by region?
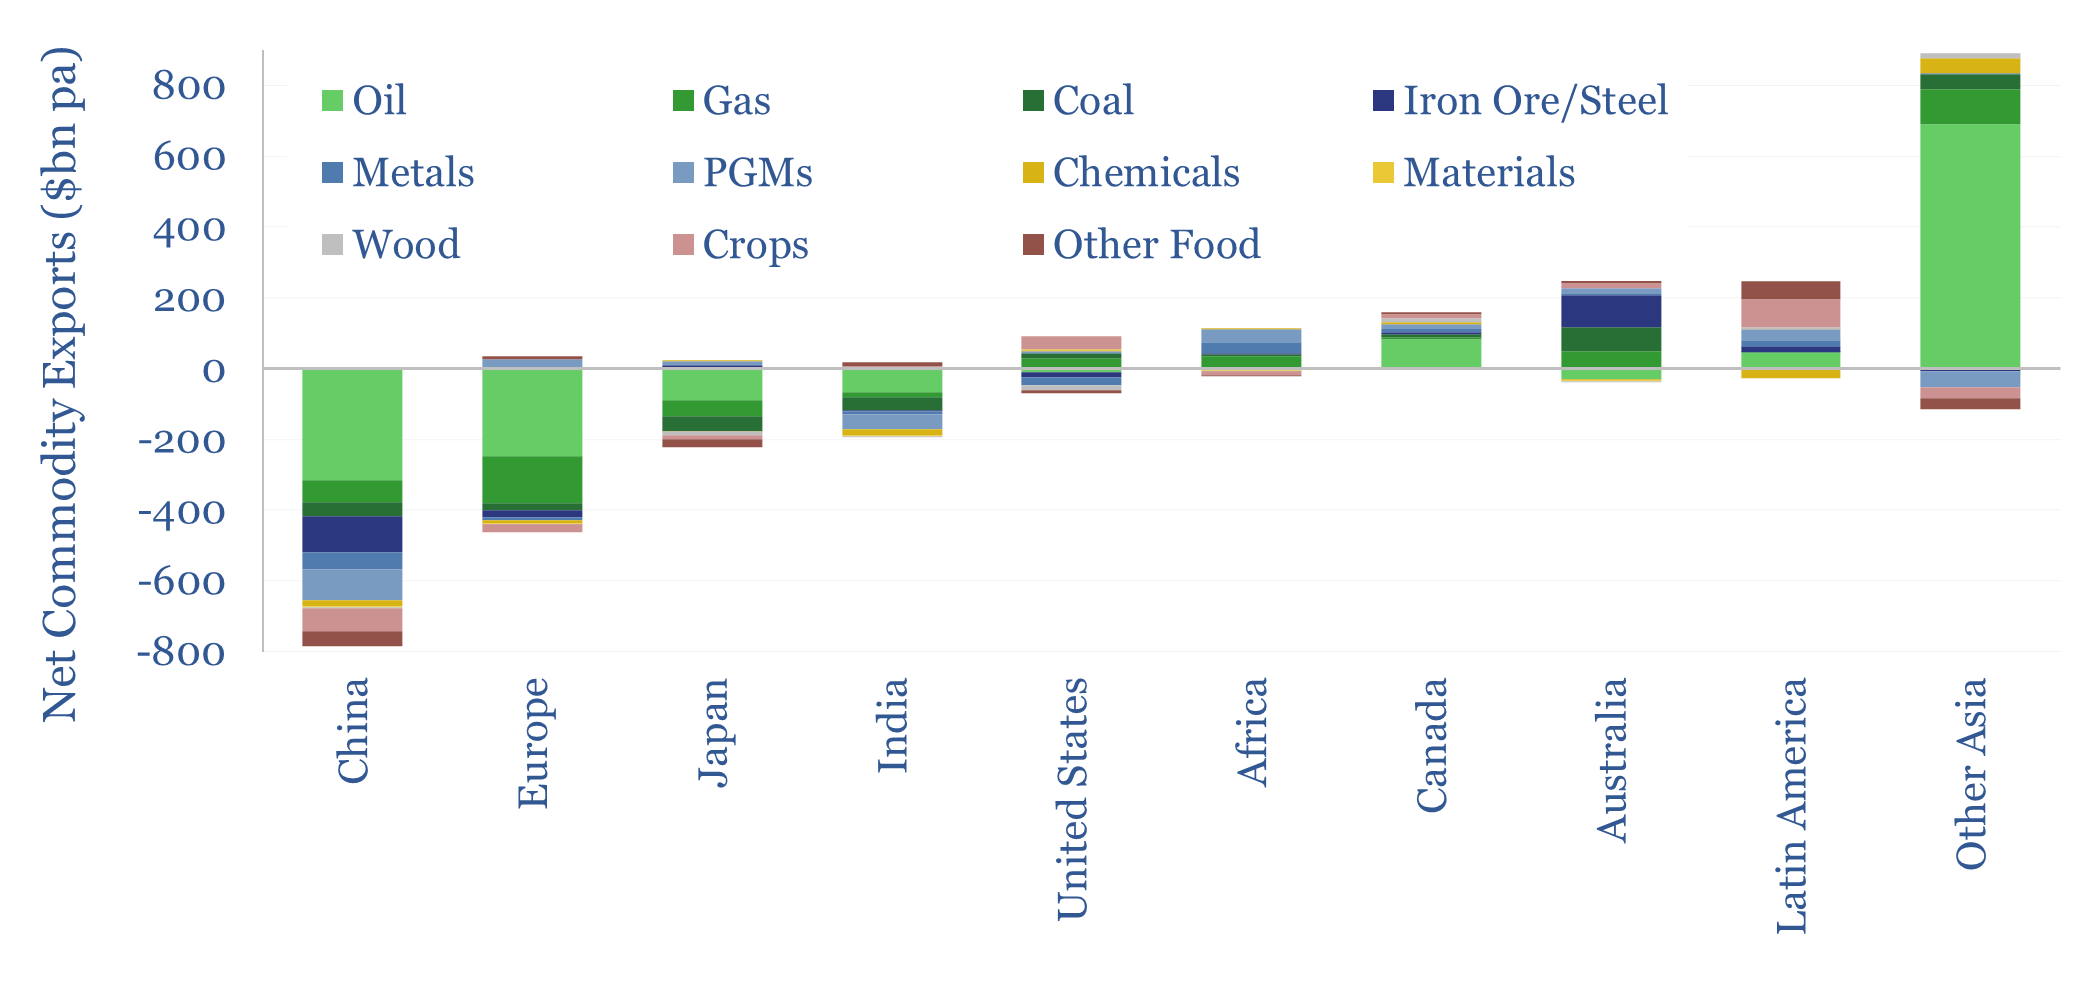
Commodities comprise over $6trn of of the world’s $33trn pa in global trade, or around 20%, alongside $10trn in services, $2trn of electronic goods, $1trn in cars, $1trn in mechanical capital goods. This data-file breaks down global commodity imports and exports, by country and by region.
-
Global oil production by country?
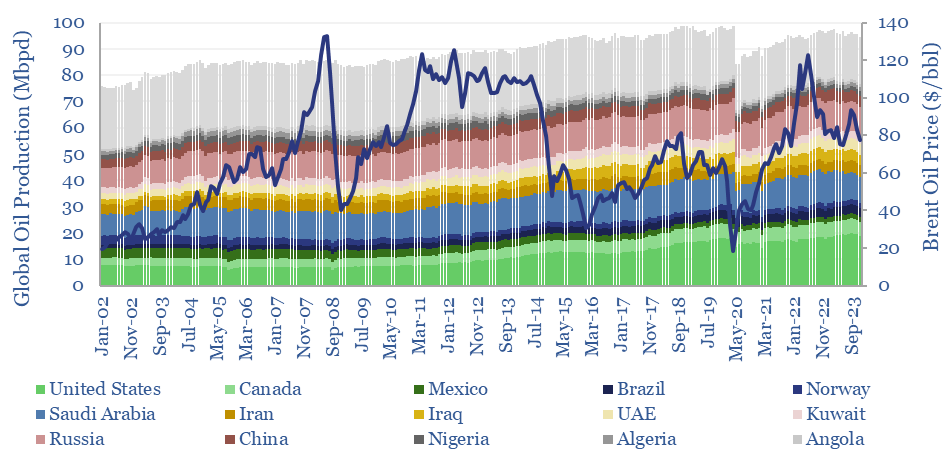
Global oil production by country by month is aggregated across 35 countries that produce 80kbpd of crude, NGLs and condensate, explaining >96% of the global oil market. Production has grown by +1Mbpd/year in the past two-decades, led by the US, Iraq, Russia, Canada. Oil market volatility is usually low, at +/- 1.5% per year, of…
-
Lula: how much growth left?
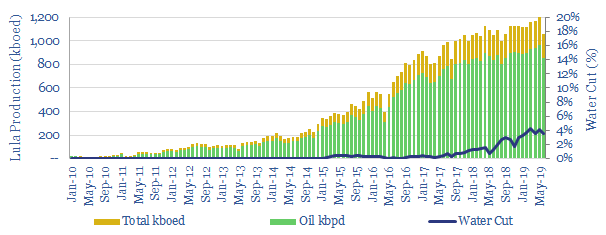
This data-file tracks the Lula oilfield, well-by-well, FPSO-by-FPSO, aggregating data from over 100 sources. The data inform our production forecasts for 2H19 and 1H20, which matter for oil markets; and for pre-salt producers. The data show wne FPSO is now constrained by gas-handling. Six other FPSOs are negotiating water-cuts. So is Lula maturing?
-
CO2 Intensity of Oilfield Supply Chains
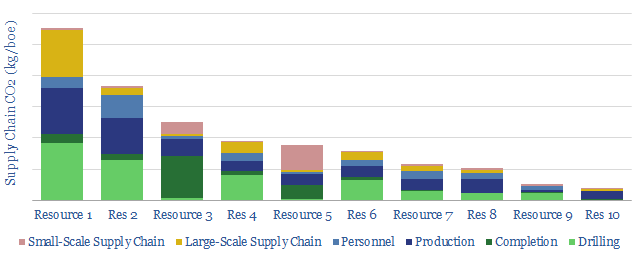
What is more CO2-intensive: the c4,000 truck trips needed to complete a shale well, or giant offshore service vessels (OSVs), which each consume >100bpd of fuel? This data-file quantifies the CO2 intensity of supply-chains, for 10 different resource types, as a function of 30 input variables.
Content by Category
- Batteries (87)
- Biofuels (42)
- Carbon Intensity (49)
- CCS (63)
- CO2 Removals (9)
- Coal (38)
- Company Diligence (92)
- Data Models (822)
- Decarbonization (159)
- Demand (110)
- Digital (58)
- Downstream (44)
- Economic Model (200)
- Energy Efficiency (75)
- Hydrogen (63)
- Industry Data (275)
- LNG (48)
- Materials (81)
- Metals (74)
- Midstream (43)
- Natural Gas (146)
- Nature (76)
- Nuclear (23)
- Oil (162)
- Patents (38)
- Plastics (44)
- Power Grids (124)
- Renewables (149)
- Screen (112)
- Semiconductors (30)
- Shale (51)
- Solar (67)
- Supply-Demand (45)
- Vehicles (90)
- Wind (43)
- Written Research (347)